









low volatility
Also called quiet market, low vol, calm market, low-volatility market
Low volatility means price is moving in small steps: candles are short, the range is narrow, and readings such as the Average True Range sit below their usual level for that market. It describes how far price moves, not which direction it goes.
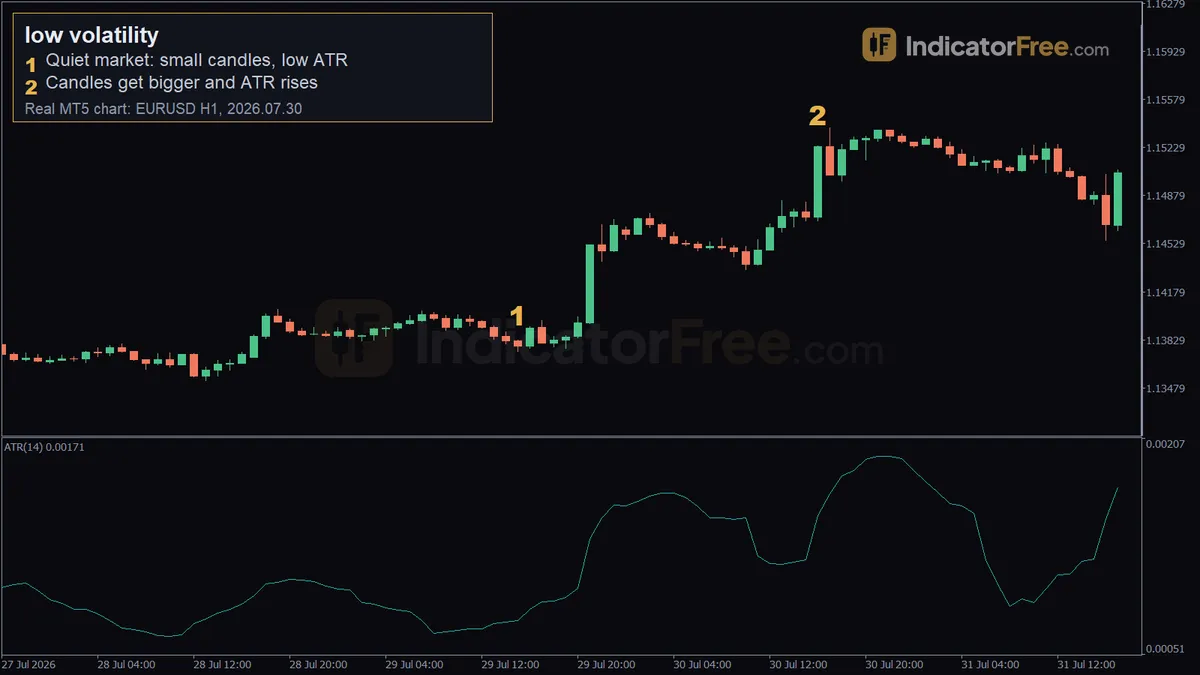
A quiet market changes the maths of every trade. Your stop and target shrink in pips, but the spread does not, so costs take a bigger share of each trade. Quiet periods also end, sometimes within one candle, and a stop sized for calm conditions is the first thing to go.
How to tell a market is in low volatility
"Low" only has meaning against the same market on the same timeframe. Work through these steps in order.
- Pick one market and one timeframe, and stay on them.
- Read the Average True Range (ATR), the average size of recent candles including gaps. The 14-period setting is the common choice.
- Compare that reading with the ATR's usual level over the last few months. Below the middle value is quiet, and far below is very quiet.
- Look at the candles: short bodies, heavy overlap, highs and lows closing in on each other.
- Check the clock. Is this a session that is quiet every day?
- Check the calendar for scheduled news in the next few hours.
The IndicatorFree Lab counted these levels on broker demo data. They are past data, not a forecast.
- EURUSD 1-hour, 2023-01-02 to 2023-06-08 (2,714 candles): the 14-period ATR averaged 14.9 pips. Half of the candles had an ATR below 14.3 pips, and the highest 10% were above 19.8 pips.
- XAUUSD 1-hour, 2025-10-02 to 2026-10-02 (5,917 candles): the ATR averaged 21.9 $. Half were below 18.9 $, and the highest 10% were above 32 $.
A rule you can copy: if the ATR is under the half-way mark for your market and timeframe, treat conditions as low volatility.
A common misread is carrying a number across timeframes. On the EURUSD 4-hour chart in the same period (680 candles), half of the candles had an ATR below 30.3 pips. So a 20-pip ATR sat in the top 10% on the 1-hour chart and in the quiet half on the 4-hour chart.
Real low volatility vs an ordinary quiet hour
A valid low-volatility phase shows an ATR below its usual level for many candles in a row, including hours that normally move. The candles overlap and neither side makes progress.
A weak reading is one that only reflects the time of day. Every market has hours when few traders are active, and small candles then say nothing about the days ahead. The chart below shows how much the average EURUSD 1-hour candle changed by session in the Lab's sample.
Quiet hours are not the same in every market. In the Lab's XAUUSD 1-hour sample (2025-10-02 to 2026-10-02), the Asian hours averaged 21.3 $ per candle, more than the London morning at 18.9 $. The quietest block for gold was late New York at 18.7 $.
The phase is broken when one candle clearly larger than the current ATR closes outside the recent range. From that point you are no longer trading a quiet market.
The EURUSD example: ATR from 10 pips to 16 pips
The chart at the top of the page is a EURUSD 1-hour chart. It is a past example, not a prediction.
Marker 1 (2026.07.29 15:00, 1.13829) sits in the quiet phase. The candles are small and the 14-period ATR is low. Before 2026.07.30 16:00 it averaged 10 pips.
Marker 2 (2026.07.30 16:00, 1.15239) is where the calm ends. The candles get bigger and the ATR rises to 16 pips, about 1.7 times its earlier level.
The lesson is in the gap between the two markers. A stop measured during marker 1 was built for 10-pip conditions, and one day later the market was moving in much larger steps.
Two ways to trade a quiet market
The figures in this section and the next are an illustrative example, not real quotes. A pair has spent hours inside a 20-pip range.
Fade the edges of the range
You buy near the bottom of the range and sell near the top, because a quiet market tends to stay inside its walls. In the chart below, drawn on a scale of pips, price dips one pip under the range low and closes back inside, 4 pips above it.
- Entry: buy on that close, 4 pips above the range low.
- Stop loss: 6 pips below the range low, under the wick, 10 pips of risk.
- Target: 2 pips under the range high, 14 pips.
Wait for the breakout
Here you do nothing while the market is quiet. You act only when a candle closes above the range high and is larger than the current ATR.
- Entry: buy 5 pips above the range high, after that close.
- Stop loss: 10 pips back inside the range, 15 pips of risk.
- Target: 20 pips above the entry, the height of the range.
A close back inside the range cancels the idea. For a break lower, mirror the levels.
Why small stops make the spread expensive
A tight stop lets you trade a bigger position for the same money at risk. The spread is paid on that bigger position. The same illustrative example continues: a $5,000 account, 1% risk, a 1-pip spread and $10 per pip on a standard lot.
The decision rule: divide the spread by your stop distance before you enter. If the cost looks too high for the target you expect, skip the trade or move to a higher timeframe where the stop is wider.
When a quiet market helps and when to stand aside
Low volatility suits range trading, patient limit orders and planning breakout levels in advance. It works best when no major news is due and the range has clear edges that price has respected more than once.
Stand aside right before scheduled news, when the range is only a few spreads tall, or when the calm is just the usual dead hours of the day.
| Pros | Cons |
|---|---|
| Clear range edges to trade against | Spread takes a larger share of each trade |
| Small stop in pips | Small targets, slow trades |
| Time to plan entries calmly | False breaks through the edges are common |
| Breakout levels are easy to mark | Calm can end in one candle |
Low volatility in an uptrend and in a downtrend
In an uptrend, low volatility often appears as a shallow, slow pullback or a sideways pause. Many traders read it as buyers resting, not leaving, until a large candle closes below the pause.
In a downtrend it is the mirror: a weak, drifting bounce or flat pause under falling prices.
The other states have their own glossary entries: high volatility, volatility contraction and volatility expansion.
Which currency pairs are usually the quietest
Pairs tend to move less when the two economies are closely linked and their interest rates move together. Crosses such as EUR/CHF, EUR/GBP and AUD/NZD are commonly named for this reason. Pairs that mix a major currency with an emerging-market currency tend to sit at the other end.
Rankings change over time, so measure before you trust a list. Divide the daily ATR by the current price to get a percentage, then compare that percentage across pairs. Raw ATR numbers are not comparable: 14.9 pips on EURUSD and 21.9 $ on gold are different units.
Practical tips for trading low volatility
- Size the stop from the range or the ATR, then set the lot size from the stop. Never do it the other way round.
- Keep a note of the usual ATR for each market and timeframe you trade, so "low" is a number, not a feeling.
- Do not widen targets to make a quiet trade look attractive. The market is telling you how far it is moving.
- Expect one false poke through a range edge. Wait for a candle close before acting on a break.
- If you hold a range trade and a candle larger than the ATR closes outside the range, exit without waiting for the stop.
Quick checklist
- ATR below its usual half-way mark for this market and timeframe?
- Quiet during hours that normally move, not only the dead session?
- No scheduled news in the next few hours?
- Spread small compared with the stop distance?
FAQ
Does low volatility mean a trade is low risk?
No. Your risk is set by position size and stop distance, not by how calm the chart looks. A tight stop with a large position can lose the same money as a wide stop with a small one, and a sudden move can fill a stop at a worse price than planned.
How long does a low-volatility period last?
There is no fixed length. It can be a few hours between sessions or several weeks when traders are waiting for a major decision. Judge it by the ATR against its usual level, and treat a large candle closing outside the range as the end.
Can I scalp when volatility is low?
You can, but the costs work against you. Scalping targets are already small, and in a quiet market the spread can take a large part of them. Run the spread-to-stop check above before every trade.