









high volatility
Also called high vol, elevated volatility, volatile market, fast market
High volatility means price is moving much more per candle than is normal for that market and timeframe: bigger candles, wider ranges and an ATR well above its normal level. It describes the size of the moves, not their direction.
When candles double in size, a stop that used to sit outside normal noise now sits inside it. Keep the same lot size and the same stop in pips and you get stopped out by ordinary movement. Widen the stop without cutting size and you risk twice the money.
What causes high volatility
- Scheduled news releases. Interest-rate decisions, inflation and jobs data can turn a quiet hour into a large candle, because many traders reprice at the same moment.
- Session opens and overlaps. More banks and traders are active when London opens and while London and New York overlap, so candles grow on the clock alone. In our Lab data for EURUSD on the 1-hour chart, the average candle range was 8.8 pips in Asian hours, 13.1 in the London morning, 17.8 in the London/New York overlap and 10.3 in late New York.
- Surprise events. Unplanned headlines, such as an unexpected central bank comment or a political shock, arrive without warning, so nobody has positioned for them.
- Thin liquidity. On holidays and around the daily rollover, few orders are waiting, so an ordinary order moves price further and spreads widen.
How to tell volatility is high: a 5-step check
- Put a 14-period ATR (Average True Range, the average candle size over the last 14 candles) on the timeframe you trade.
- Compare the reading with that market's own normal, never with another market or timeframe.
- Call it high when ATR sits in the top tenth of its own history. The table below gives measured thresholds.
- Check the hour. A big candle in a busy session can be normal for that session.
- Confirm on the candles: several large candles in a row, not just one.
| Market | Timeframe | Median ATR(14) | Top 10% starts above |
|---|---|---|---|
| EURUSD | 1-hour | 10.8 pips | 16.3 pips |
| EURUSD | 4-hour | 22.7 pips | 32.9 pips |
| Gold (XAUUSD) | 1-hour | $18.7 | $31.2 |
| Gold (XAUUSD) | 4-hour | $38.5 | $67.5 |
These are IndicatorFree Lab counts on broker demo data: past data, not a forecast. EURUSD covers 22 October 2025 to 23 October 2026 on the 1-hour chart (6,222 candles) and 23 October 2025 to 23 October 2026 on the 4-hour chart (1,556 candles). Gold covers the same periods (5,916 1-hour and 1,548 4-hour candles).
The gap between normal and high differs by market. On the EURUSD 1-hour chart the top-10% line is about 1.5 times the median. On gold it is about 1.7 times, so gold's busy hours stretch further from its normal.
Step 4 matters because the clock alone changes candle size. The chart below shows the average 1-hour EURUSD candle range in each session over the same Lab period.
Hours are broker server time. An 18-pip candle in the overlap is an average hour, while the same candle in Asian hours is unusual.
Gold follows a different clock. Its 1-hour candles averaged $20.9 in Asian hours, $18.5 in the London morning, $30.4 in the overlap and $18.3 in late New York (October 2025 to October 2026, past data, not a forecast). Its Asian hours were busier than its London morning.
Real high volatility versus a false reading
A valid reading has three things together: ATR well above its median, a run of large candles, and candles that are large for that hour of the day.
A weak reading rests on one candle. A single news candle stays inside a 14-period ATR for 14 candles, so the line stays high after the market has calmed. If the last three to five candles are small again, treat the reading as stale.
A reading is broken when the comparison is wrong. A weekend gap inflates true range without any tradable movement. Comparing a 4-hour ATR with a 1-hour one, or gold's dollars with EURUSD's pips, tells you nothing.
The EURUSD 1-hour example, marker by marker
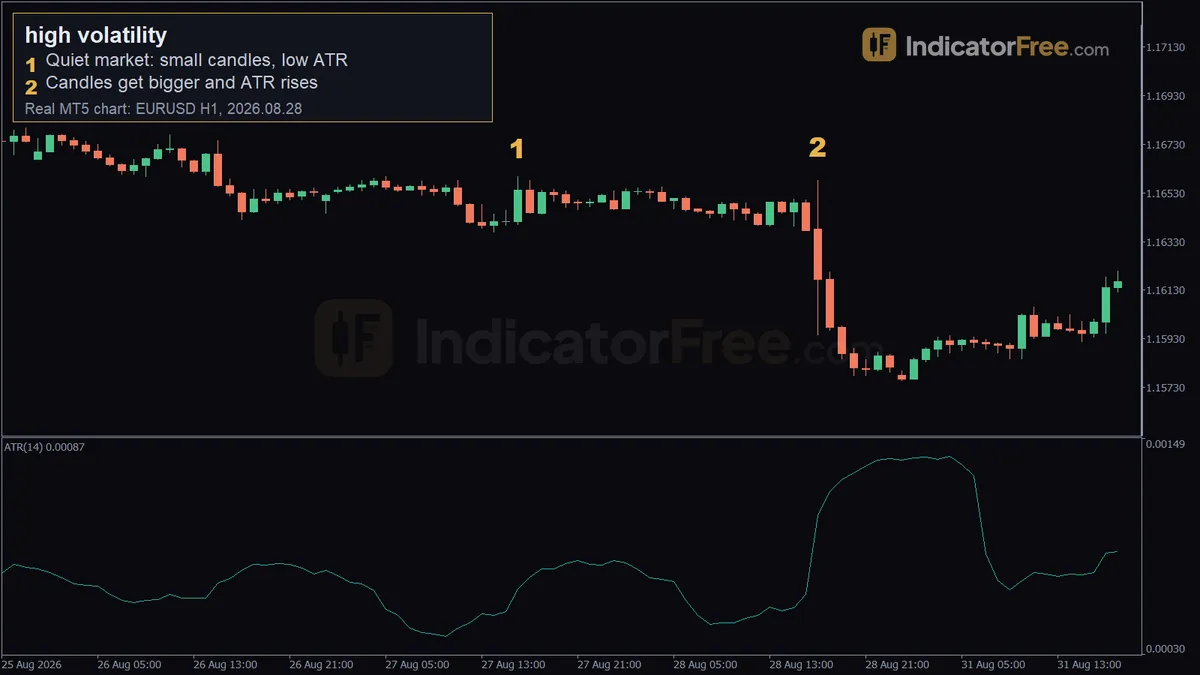
The chart at the top of the page is a past example, not a prediction.
Marker 1 (27 August 2026, 16:00, price 1.16598). The market is quiet. Most hourly candles around this marker are under 10 pips and the 14-period ATR averages 7 pips. The marker candle itself is larger, 19.8 pips from 1.16400 to 1.16598, but one candle among 14 does not lift the average much.
Marker 2 (28 August 2026, 17:00, price 1.16582). The candles grow and ATR rises to 11 pips, 1.6 times higher than before. This is volatility rising from a quiet spell. By the top-10% test in step 3 it is not high volatility yet: 11 pips is about the median (10.8) and well below the 16.3-pip top-10% line in the table. After a spell at 7 pips a 1.6-times jump feels fast, but a rising ATR and a high ATR are different tests. The single 17:00 candle, though, is a clear high-volatility bar: it spans about 64 pips from 1.16582 to 1.15946, about three and a half times the 17.8-pip average overlap candle. ATR averages 14 candles, so it has not caught up yet. One bar can be high-volatility on its own, but the market only counts as high-volatility once a run of such bars lifts ATR over the line.
One detail is easy to miss. The 17:00 candle opened at 1.16382, reached 1.16582, then dropped to 1.15946 and closed at 1.16174. The same candle went 20 pips up and more than 60 pips down. Volatility tells you how far price can travel, not which way.
Two ways to trade a high-volatility market
The prices and account figures in this section are an illustrative example.
Setup: buy the first pullback after the range expands
Chasing the first big candle gives you a poor entry and a distant stop. Waiting for the first pullback gives you a nearby low to place the stop behind.
- Entry: price leaves the quiet range, pulls back, then prints a bullish candle. Buy when the next candle trades above that candle's high, the Entry line in the chart.
- Stop loss: the last five candles average about 20 pips, and ATR is catching up to that. A stop of 1.5 times that 20-pip figure is 30 pips below the entry. That is below the pullback low and on the top of the old range.
- Target: 60 pips above the entry, twice the risk.
For a short, mirror every step below a quiet range.
Sizing: same dollars at risk, wider stop
The stop grew from what a quiet market needs to what a fast one needs. Your position must shrink by the same proportion. A standard lot on a USD-quoted pair is worth $10 per pip.
At 0.20 lots each pip is worth $2. The 30-pip stop loses $60 and the 60-pip target makes $120. Had you kept 0.50 lots, the same stop would lose $150.
When high volatility helps and when to stand aside
It suits trend and breakout trading in liquid hours, when large candles keep closing in one direction. Avoid it when large candles alternate direction with long wicks, in the minutes around scheduled news, and when the stop you need makes your position smaller than your broker's minimum.
| Pros | Cons |
|---|---|
| Targets are reached in fewer candles | Stops must be wider, so size must be smaller |
| Breakouts travel further from the range | Spreads often widen and orders slip |
| Trading costs are a smaller share of each move | Wicks hit stops placed at quiet-market distances |
| Clear momentum is easier to see | Losses arrive faster, which pushes you to overtrade |
Bullish and bearish high volatility
Bullish: large candles close near their highs and pullbacks stay shallow, so the extra movement is buyers in control.
Bearish: large candles close near their lows, often after a sharp drop that begins with one outsized candle, as in the top chart, where the 17:00 candle on 28 August closed about 21 pips below its open and the next two candles kept falling to 1.15869.
Tips for trading fast markets
- Recalculate lot size before every trade. Yesterday's size belongs to yesterday's ATR.
- Never widen a stop after entry. Decide the wider distance before you click.
- Prefer limit orders on pullbacks. Market orders in a fast market fill at worse prices than you see.
- Count correlated positions as one trade. Two pairs that share a currency will move together when it is the one driving the move.
- Check the news calendar first. If a release is minutes away, the current ATR understates what is coming.
- Set a daily loss limit in money and stop when you reach it.
Quick checklist
- Is ATR in the top tenth of its own history on my timeframe?
- Are the candles large for this session, not just for the day?
- Is my stop based on the current ATR?
- Did I cut lot size so the money at risk is unchanged?
FAQ
What is considered high volatility in stocks?
The same test applies: the stock's daily range is large against its own history. Because share prices differ so much, express ATR as a percentage of price before comparing two stocks. Earnings dates are the usual scheduled cause.
Which forex pairs have high volatility?
Pairs that include the pound or the yen, and exotic pairs, usually move more per day than EURUSD. Rankings change over time, so measure them yourself: divide each pair's daily ATR by its price and compare the percentages.
Should a beginner trade during high volatility?
Only with a smaller position and a stop set from the current ATR. If you cannot yet work out lot size quickly, practise on a demo account in these conditions first.