









Volatility
Also called Market volatility, Price volatility, Historical volatility
Volatility is how far and how fast a price moves in a set period of time. In forex it is usually measured in pips per candle, often with the Average True Range (ATR).
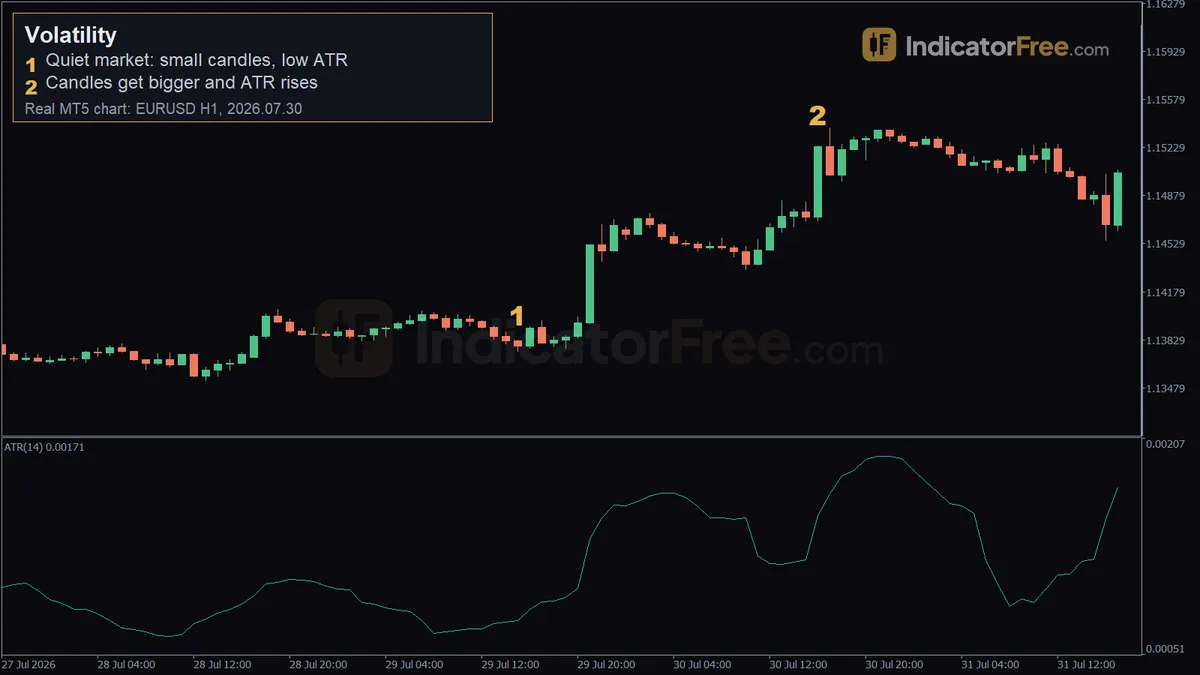
Volatility sets two numbers on every trade: how far away your stop loss must sit to survive normal price swings, and how many lots you can trade for the same money at risk. If you misjudge it, an ordinary swing can stop out a good trade idea. Or a position you thought was small can lose far more than you planned.
How to tell if the market is quiet or volatile right now
Use the same steps every time, so your read does not depend on your mood.
- Add the Average True Range (ATR) to your chart, usually set to 14 periods. A candle's true range is its high-to-low distance, extended to cover any gap from the previous close. ATR is a smoothed average of the last 14 true ranges.
- Compare today's ATR with that market's own normal level, not with another market. Gold is measured in dollars and EURUSD in pips, so their raw ATR numbers cannot be compared.
- Look at the candles and wait for the change to last. Treat volatility as higher only when several candles in a row have longer ranges than the ones before them.
- Check the clock. The same pair can move twice as far per hour in one trading session as in another.
- Check the economic calendar. One scheduled data release can turn a quiet hour into the biggest candle of the week.
Normal vs extreme volatility: the numbers from 12 months of data
You can look up what "normal" is. The IndicatorFree Lab measured ATR(14) on 12 months of broker demo data, from 2025-10-02 to 2026-10-02. These are past data, not a forecast.
| Market and timeframe | Average ATR | Half of candles below | Top 10% above |
|---|---|---|---|
| EURUSD 1-hour | 11.7 pips | 10.9 pips | 16.2 pips |
| EURUSD 4-hour | 24.1 pips | 22.7 pips | 32.9 pips |
| Gold (XAUUSD) 1-hour | $21.9 | $18.9 | $32 |
| Gold (XAUUSD) 4-hour | $44.8 | $38.9 | $67.9 |
Use the middle value (the "half of candles below" column) as your quiet line and the top-10% value as your stretched line. The table near the end shows what to do in each case. Once a month, write down your market's middle ATR value and its top-10% level, so these lines stay current.
The time of day matters just as much. The chart below shows EURUSD's average 1-hour candle range in each session, from the same data (server time).
In the London/New York overlap, EURUSD moved about twice as far per hour as in Asian hours. Gold does not follow the same pattern. Its Asian-hours range ($21.3) was higher than its London-morning range ($18.9), and the overlap was again the busiest at $30.9. Check each market on its own before you assume a session is quiet.
A real volatility expansion on EURUSD, marker by marker
The chart at the top of the page is a past 1-hour EURUSD example, not a prediction.
- Marker 1 (2026.07.29 15:00, 1.13829): a quiet market. The candles are small and the 14-period ATR averaged about 10 pips, just under the Lab's middle value of 10.9 pips.
- Marker 2 (2026.07.30 16:00, 1.15239): the candles get bigger and ATR rises to about 16 pips, roughly 1.7 times its earlier level. That is right at the edge of the top 10% of all 1-hour EURUSD readings (16.2 pips). It also falls inside the overlap hours, when EURUSD averaged 17.8 pips per hour against 8.8 pips in Asian hours.
Between the two markers, price rose 141 pips (1.15239 − 1.13829 = 0.01410). A stop that fit the market comfortably at marker 1 would have been too tight by marker 2.
Real expansion or a one-candle spike?
A valid expansion has three signs: several candles in a row are bigger than before, ATR climbs step by step and stays high, and the move happens in active hours or after a known event. That is what the example above shows.
A weak or broken reading looks different:
- One giant news candle. It keeps ATR high for the next 14 bars, even if every candle after it is tiny. Traders often misread this as a market that is still busy. To spot it, look at the last three candles: if each one is smaller than the current ATR, the market has calmed and the ATR reading is out of date. The chart below shows this.
- Long wicks in thin hours. When few traders are active, spreads widen. Charts are usually drawn from bid prices, so a wider spread can push the printed low below where real trading took place.
- Cross-market comparisons. A 20-pip ATR is high for one pair and quiet for another. Only the market's own history tells you which.
Sizing your stop and lot to the current volatility
Here is an illustrative example: a $16,000 account risking 1% per trade on EURUSD. The stop is 2 × ATR, the target is 3 × ATR, and one standard lot (100,000 units) is worth $10 per pip. The ATR values come from the real chart above: 10 pips while quiet, 16 pips once busy.
In the quiet phase you get a 20-pip stop, a 30-pip target (3 × 10) and 0.80 lots. In the busy phase you get a 32-pip stop, a 48-pip target (3 × 16) and 0.50 lots. The money at risk is $160 both times. Only the distances and the lot size change.
Now the common mistake: you widen the stop but keep 0.80 lots. Then the same trade risks 0.80 × 32 × $10 = $256, 60% more than you planned.
Does volatility have a bullish or bearish version?
No. Volatility measures how big the moves are, not which way they go. A rising ATR can come with a rally, as in the example above, or with a sell-off.
To judge direction, use trend or market structure. Use volatility to set distances and position size.
When high and low volatility help you, and when to stand aside
| Condition | What helps you | What hurts you | What to do |
|---|---|---|---|
| Low (ATR below the middle value) | Tight stops, larger size for the same risk | Small targets; the spread is a bigger share of each move; breakouts have less momentum behind them | Keep targets modest; wait for candles to grow before trusting a breakout |
| Normal | Stops and targets behave as planned | Little extra risk | Trade your usual plan |
| High (ATR above the top-10% line) | Targets are reached faster | Normal swings hit stops; reversals are sharp | Wider stop, smaller lot |
| News spike | Large move within minutes | Spreads widen; orders can fill well past your price | Stay out through the release, or cut size |
Avoid fresh entries in the minutes around major releases unless your plan is built for them. Also avoid reading a quiet Asian session on EURUSD as a sign that the trend is over. Quiet hours are normal for that pair.
Quick volatility checklist before you enter
- Where is ATR now compared with this market's middle value and top-10% line?
- Which session is it, and is major news due in the next hour?
- Has the move lasted several candles, or is it one spike?
- Is your stop an ATR multiple, with the lot size recalculated for the same money risk?
FAQ
What is volatility trading in options?
Options prices include implied volatility, which is the size of move the market is pricing in for the future. ATR measures historical volatility from past candles instead. Volatility trading with options means buying options when you expect bigger moves than the price implies, or selling them when you expect smaller ones.
What ATR setting should I use for day trading vs swing trading?
The timeframe matters more than the period. Most traders keep 14 periods and read ATR on the chart they trade: 1-hour or lower for day trades, 4-hour or daily for swing trades. In the Lab data for EURUSD (2025-10-02 to 2026-10-02, past data, not a forecast), the 4-hour ATR averaged 24.1 pips, about twice the 1-hour average of 11.7 pips. So a swing stop based on 4-hour ATR sits much further away, and needs a smaller lot for the same money risk.