









Bollinger Band width
Also called Bollinger BandWidth, BBW, band width, Bollinger squeeze width
Bollinger Band width is the distance between the upper and lower Bollinger Bands, in pips or as a percent of the middle band. A low width means price is quiet and compressed. A rising width means volatility is expanding.
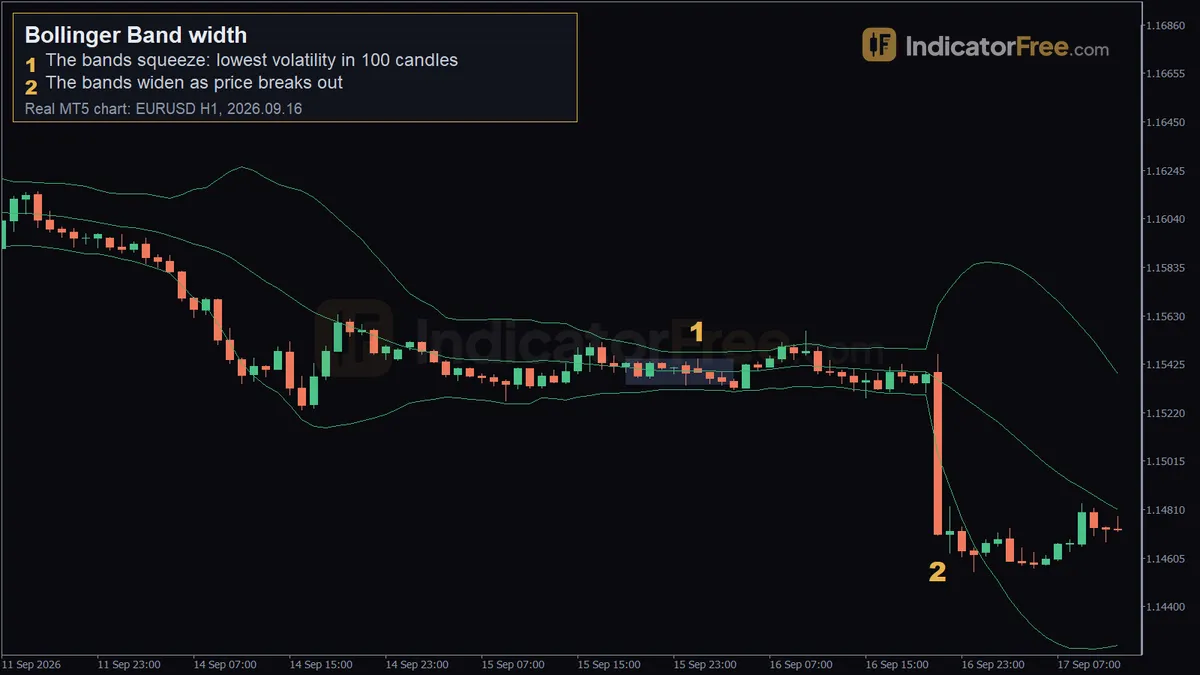
Quiet markets rarely stay quiet. When the width falls to its lowest reading in 100 candles, a bigger move often follows. A stop sized for today's calm range may soon sit inside normal noise. The width tells you when to get ready. It does not tell you which way price will go.
Calculating Bollinger Band width in pips
Subtract the lower band from the upper band. That gives you the width in price, and you convert it to pips. The standard settings are a 20-period average with bands 2 standard deviations away (MT5 defaults: period 20, shift 0, deviations 2, applied to Close). With those settings the width always equals 4 standard deviations, because each band sits 2 deviations from the middle. Divide the width by 4 and you get the size of one standard deviation, which is the typical distance of closes from their average.
The calculation below uses round illustrative numbers on a EURUSD chart.
The BandWidth version divides the width by the middle band and shows it as a percent. Use the percent when you compare markets with very different prices, such as gold and EURUSD, or the same market a year apart. On a single pair over a few weeks, pips are fine.
Identifying a Bollinger squeeze: the checklist
A squeeze is a band width that has dropped to its lowest level over a long lookback. Check these in order:
- Use the standard settings of 20 periods and 2 deviations, so the readings are comparable.
- Look back 100 candles. Is the current width the lowest in that window? If it is not, you do not have a squeeze yet.
- Check that the candles inside the bands are small and overlapping. A low width should match what you can see on the chart.
- Mark the high and low of the quiet stretch. Those are your breakout levels.
- Wait for the width to turn up and for a candle to close outside the band and beyond the stretch's high or low.
The chart below shows the pattern: candles shrink, the width line makes a new low, and then both expand together when price breaks lower.
What makes a squeeze valid, weak or broken
A valid squeeze shows a genuine new low in width with small, overlapping candles. It ends when a candle with a full body closes outside the band and the middle band starts to slope in the same direction: up for a bullish breakout, down for a bearish one like the 16 September example.
A squeeze is weak when the low width comes from a holiday or the quiet hours between sessions. In that case low liquidity, not a coiling market, is pulling the bands in. Watch for a second trap too. The width can drop sharply on the candle when a large candle drops out of the 20-candle window, even if the candles on screen have not changed. That is a quirk of the calculation, not real compression.
A squeeze is broken when price closes outside the band and then closes back inside within one to three candles. It is also broken when both bands widen in a whipsaw of long wicks on both sides. A scheduled news release inside the squeeze makes either outcome more likely.
Reading the EURUSD 1-hour squeeze of 16 September 2026
The chart at the top of the page is a past example, not a prediction.
Marker 1, 01:00, price 1.15446. The bands were 16 pips wide, the narrowest in 100 candles. Divided by 4, that is a standard deviation of only 4 pips. This was the squeeze. At this point nothing on the chart showed the direction.
Marker 2, 21:00 the same day, price 1.14701. The bands were twice as wide, about 32 pips. Price had fallen, and the full move from the squeeze reached 84 pips. That 84 pips measures the whole move, so it is larger than the gap between the two marker prices. This squeeze broke downward. The width signalled that a move was coming. The breakout candle showed which way.
How often a squeeze appears: Lab counts
The IndicatorFree Lab counted new 100-candle lows in band width on broker demo data from 2025-10-02 to 2026-10-02. This is past data, not a forecast.
On the 1-hour charts you get roughly one squeeze a week. On the 4-hour charts you get about one a month. If you think you see a squeeze every day, your lookback is too short.
A close outside the bands is far more common than a squeeze. On EURUSD 1-hour, 13.2% of candles closed outside the (20, 2) bands, and on XAUUSD 1-hour the figure was 12.3%. That is about one candle in eight, so a close outside the band only counts as a breakout when it comes straight after a squeeze. With 2.5 deviations, the share on EURUSD 1-hour fell to 5%.
Trading setups built on band width
The numbers in both setups are an illustrative example on EURUSD 1-hour. They are given in pips, so you can apply them at any price.
Squeeze breakout
The width makes a 100-candle low of 20 pips. The quiet stretch is 20 pips tall. A candle then closes 5 pips below the stretch low, outside the lower band.
- Entry: sell on the close of the breakout candle.
- Stop loss: 2 pips above the stretch high. Risk = 5 + 20 + 2 = 27 pips.
- Target: twice the risk. 27 × 2 = 54 pips below your entry. Close early if the width stops rising for two candles in a row while price stalls.
Head-fake reversal
After the same squeeze, price spikes above the upper band to a high 6 pips above the stretch. Two candles later it closes back inside, 16 pips below that spike high. This failed break is called a head fake.
- Entry: sell on the close back inside the bands.
- Stop loss: 4 pips above the fake high. Risk = 16 + 4 = 20 pips.
- Target: 40 pips below your entry, beyond the far side of the stretch. Reward = 40 pips, twice the risk.
When band width helps and when to leave it alone
It works best when a market has drifted sideways for a while and a clear trigger can follow, such as a session open. It works poorly right before high-impact news, during holidays, and in markets that are already trending hard. In a strong trend the width is high and tells you little.
| Pros | Cons | |
|---|---|---|
| Timing | Flags the quiet phase before a move | Says nothing about direction |
| Simplicity | One number, easy to compare over time | Depends on the lookback you choose |
| Risk | Helps you size stops to current volatility | Head fakes are common straight after a squeeze |
| Scope | Works on any market and timeframe | Pip widths cannot be compared across markets |
Practical tips for trading band width
- If news is due inside the squeeze, skip the first close outside the bands and wait until the move holds for 1-3 candles.
- If the width rises but price stays inside the stretch, do not trade. Volatility is growing with no direction yet.
- Size your stop from the stretch, not from the bands. The bands will widen against you after you enter.
FAQ
Can the width make a new low again after a false breakout?
Yes. If price closes back inside and the candles shrink again, the width can fall further and set a fresh 100-candle low. Treat it as a new squeeze and mark the high and low of the new stretch.
How do I add a Bollinger BandWidth indicator to my chart?
Many charting platforms list it as Bollinger BandWidth or BBW, usually shown as a percent in a separate panel below price. If yours does not have it, read the upper and lower band values and subtract them. You get the same information.
Should I use 2 or 2.5 deviations for band width?
Use 2 for squeezes so your readings match most references. A wider setting changes the size of the width but not where its lows fall, so it rarely changes when you spot a squeeze.