Trend channel
Also called price channel, channel lines
A trend channel is a pair of parallel trendlines drawn along a market's swing highs and swing lows, marking the rough zone where price has been moving.
How it works
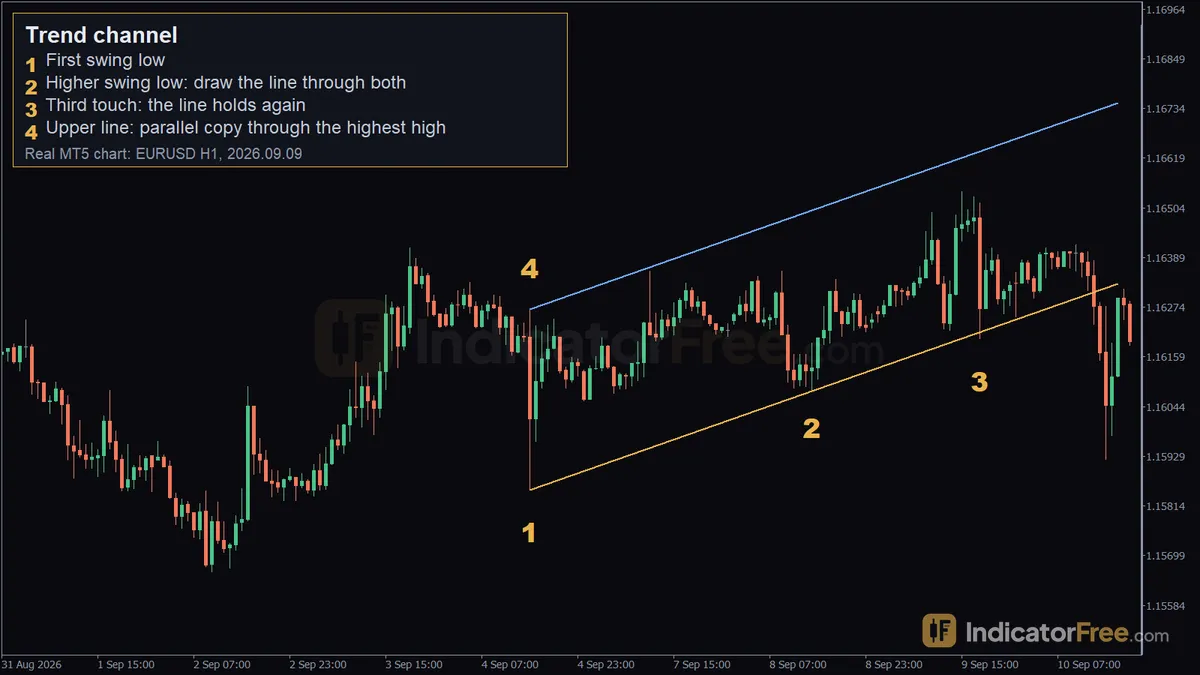
A trend channel is built from two parallel trendlines. In an uptrend, the lower line connects at least two rising swing lows. The upper line is a parallel copy of the lower line, shifted so it touches the highest swing high in the same stretch of price. In a downtrend the process is mirrored: the upper line connects falling swing highs, and the lower line is a parallel copy through the lowest swing low.
There is no single formula behind it; it is a geometric construction. Once both lines are drawn, the gap between them stays constant along the whole channel, because the upper line is just a parallel offset of the lower one (or the other way round). Traders watch for price to react near either line - holding near the lower line in an uptrend, or stalling near the upper line - and watch for a close beyond either line as a possible sign the move is changing.
Example
This is a past example on EURUSD H1, not a prediction.
- On 2026.09.04 15:00, EURUSD printed a swing low at 1.15851. That is the first point for the lower line.
- On 2026.09.08 14:00, a higher swing low formed at 1.16080. A line drawn through this low and the first one (1.15851) becomes the lower boundary of the channel.
- On 2026.09.09 18:00, price came back down to 1.16201 and held near that same rising line - a third touch confirming the lower boundary.
- The upper line is a parallel copy of the lower line, drawn through the highest high of the period, 1.16269, which also occurred on 2026.09.04 15:00.
Measured between the two lines, the channel was about 42 pips wide. After the third touch at 1.16201, EURUSD rose about 21 pips over the next 15 H1 candles, moving back toward the upper line.
How to use it on MT5
- Open the chart and timeframe you want to study, then pick the Trendline tool, or the Equidistant Channel tool (draws both lines at once), from the Insert > Line Studies menu or the toolbar.
- Click on two swing lows (uptrend) or two swing highs (downtrend) to set the first line.
- With the Equidistant Channel tool, MT5 draws the parallel line automatically; drag its middle handle so it touches the opposite extreme (the highest high or lowest low in that stretch).
- Open the line's properties and tick "Ray" to extend both lines to the right, so you can watch price approach them on new candles.
- Re-draw or adjust the channel whenever a new swing no longer fits the old lines - a channel is not fixed forever.
Common mistakes
- Drawing a line through only one swing low or high and calling the channel confirmed - each line needs at least two touches to mean anything.
- Forcing the lines to fit by ignoring wicks that poke through, instead of accepting that the channel has broken.
- Treating a touch of the channel line as an automatic buy or sell signal without checking other context, such as news events or the higher-timeframe trend.
- Leaving an old channel on the chart after price has clearly broken out of it, which can make a new move look like it is still contained.
FAQ
Does a trend channel predict where price will go next? No. It only describes how price has moved between two lines so far; a breakout can happen at any time. Can a trend channel be flat? A flat channel is usually called a trading range or rectangle rather than a trend channel, since there is no clear up or down slope.