









Pin bar
Also called Pinocchio bar, Pin candle, Rejection candle
A pin bar is a candlestick with one long wick and a small body at the other end. It shows that price was pushed to a level, rejected there, and closed back near where it opened.
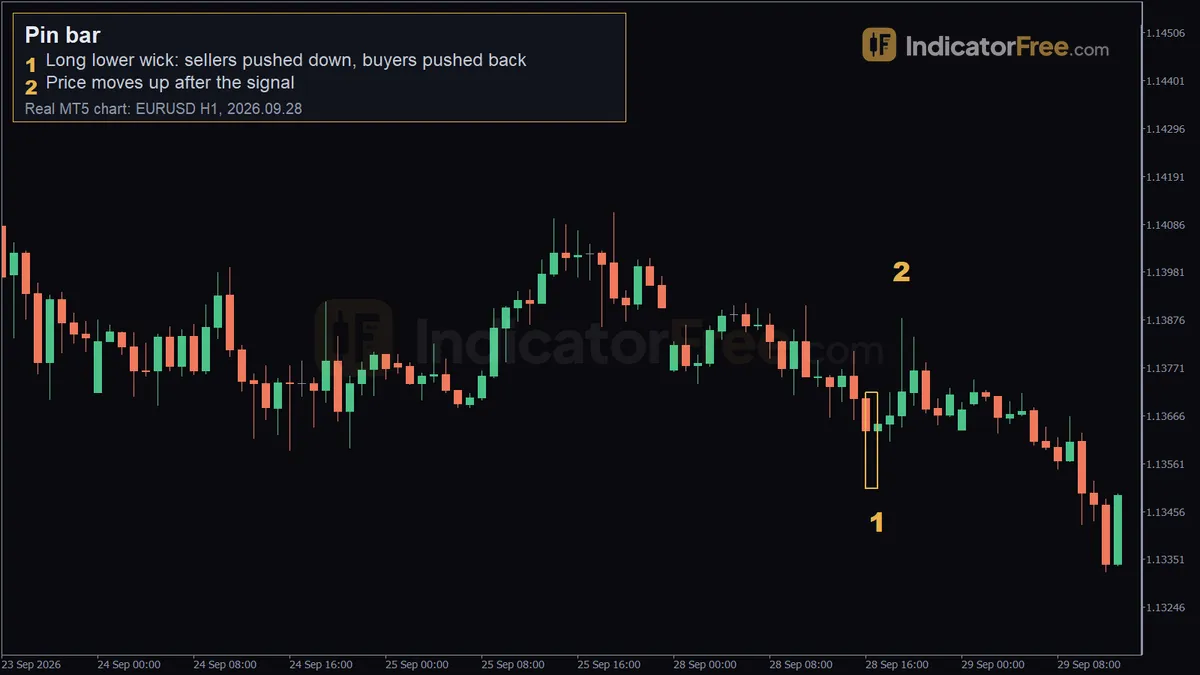
The long wick marks a price the market tested and refused. The tail tells you exactly where to put your stop, so you know your risk in pips before you click buy. If you misread it, though, you end up buying a candle that only looked like a rejection.
Bullish and bearish pin bars
A bullish pin bar has a long lower tail and its body near the top of the candle. It shows buyers rejecting lower prices, and it carries the most weight at support or during a pullback in an uptrend.
A bearish pin bar is the mirror image: a long upper tail and a body near the low. It shows sellers rejecting higher prices at resistance.
How to identify a pin bar: a 6-point checklist
Check the candle only after it has closed. A candle that looks like a pin bar 40 minutes into the hour can still close as something else.
- One long wick (the tail). The tail covers at least 60% of the candle's full range, from high to low.
- Small body. The body is no more than about a third of the range, and the tail is at least twice as long as the body.
- Body at one end. The body sits in the outer 40% of the range, on the side opposite the tail.
- Short opposite wick. The wick on the body side is clearly shorter than the tail. If both wicks are long, the candle shows indecision, not rejection.
- The tail sticks out. The tail reaches past the lows (or highs) of the few candles before it. A tail hidden inside recent candles did not reject any new price.
- It sits at a level. The tail touches support, resistance, a prior swing high or low, or a zone you marked before the candle formed.
Points 1-4 describe the shape. Points 5-6 decide whether the shape means anything.
Valid, weak or broken: grading a pin bar
A valid pin bar passes all six points. Its tail shows a real push that failed, at a price where you already expected a reaction.
A weak pin bar has roughly the right shape but a flaw. The body may drift toward the middle, the opposite wick may be almost as long as the tail, or the candle may form in open space with no level nearby. Treat it as a note on your chart, not a trade.
A pin bar is broken once a later candle closes beyond the tip of its tail. For example, if a later close takes out the low of a bullish pin, the rejection did not hold. Exit or cancel the order. Do not add to a losing position.
The drawing below shows a valid pin next to a weak one and a candle that does not qualify at all.
Reading the EURUSD 1-hour pin bar on the chart above
The chart at the top of this page is a past EURUSD 1-hour example, not a forecast. The pattern is the candle at 2026.09.28 17:00: open 1.13632, high 1.13691, low 1.13532, close 1.13648.
Marker 1: the long lower wick at 1.13532. During that hour, sellers pushed price down to 1.13532. Buyers then pushed it back up, and the candle closed at 1.13648, above its open. That round trip is the rejection.
Here is the candle checked against the checklist with its real prices:
- Full range: 1.13691 − 1.13532 = 15.9 pips.
- Lower tail: 1.13632 − 1.13532 = 10.0 pips, about 63% of the range.
- Body: 1.13648 − 1.13632 = 1.6 pips, so the tail is more than six times the body.
- Upper wick: 1.13691 − 1.13648 = 4.3 pips, shorter than the tail but not tiny.
Pins that only look long often fail this maths, so measure the tail as a share of the range every time.
The shape is valid, but it is not a textbook one. The 4.3-pip upper wick shows sellers still had some control near the top of the hour. Before trading it, you would also check point 6: was 1.13532 near a level you had already marked?
Marker 2: price moves up after the signal (19:00, 1.1388). By 19:00, price had climbed to about 1.1388. Over the next 10 candles, the move measured 23 pips up from the pin bar's close.
Pin bar setups with entry, stop loss and target
Buying the break of the EURUSD pin bar's high
A common entry is a buy stop order at the pin bar's high. The order only fills if the market confirms the rejection by moving higher. The prices below come from the real candle. The account size further down is an illustrative example.
- Entry: 1.13691, the pin bar's high.
- Stop loss: just below the tail's low of 1.13532, with a 0.1-pip buffer. Risk = 16 pips.
- Target: 16 pips above the entry for one times the risk (1R), or 32 pips above it for two times the risk (2R).
In live trading, make the buffer at least as wide as the spread, so the normal gap between bid and ask cannot trigger your stop. The 0.1 pip here only keeps the arithmetic simple.
From the 1.13691 entry, price reached about 1.1388, roughly 19 pips (1.1388 − 1.13691 = 18.9). That is past the 16-pip 1R target but short of the 32-pip 2R target. That is the trade-off: a closer target is hit more often, and a farther one pays more when it is hit.
To size the trade, take an $8,000 account that risks 1% per trade. One standard lot (100,000 units) of EURUSD is worth $10 per pip.
Selling a bearish pin bar at resistance
The illustrative chart below shows price rising into a resistance line that had already turned it back once. A bearish pin bar pokes above the line, then closes back below it.
- Entry: a sell stop at the pin bar's low. The next candle triggers it.
- Stop loss: just above the tip of the tail, with a 2-pip buffer to cover the spread. Risk = 31 pips.
- Target: 2R = 62 pips below the entry.
If price had closed above the tip of the tail first, the pin bar would have been broken and the stop hit.
When pin bars work and when to skip them
Pin bars are most useful when they agree with the bigger picture. Examples are a bullish pin at support in an uptrend, or a bearish pin at resistance in a downtrend. Longer timeframes, such as the 4-hour and daily charts, produce fewer pin bars, but each one reflects more trading.
Skip pin bars in tight sideways markets, where long wicks appear every few candles and mean little. Skip pins that form around major news releases, because a quick spike and snap-back there often comes from thin liquidity rather than a real decision by traders. Also skip a pin that goes against a strong trend in open space, with no level behind it.
| Aspect | Pro | Con |
|---|---|---|
| Stop placement | The tail gives a clear, logical stop | A long tail means a wide stop and a smaller position |
| Clarity | Easy to spot once the candle has closed | Traders use different shape rules |
| Timing | The signal is complete at the candle close | An entry at the close may have to sit through a pullback into the tail |
| Context | Appears on any market and timeframe | Means little without a level or trend behind it |
Pin bar trading tips from the chart
- If the tail is wider than your risk budget allows, skip the trade or reduce your size. Never tighten the stop to make it fit. A stop inside the tail sits in the exact zone price just tested.
- If a candle closes beyond the tail before your entry fills, cancel the order. The setup is broken, and a pending order left in place can still fill later on an unrelated move.
- On large pin bars, consider a 50% entry. A limit order halfway along the tail gives a tighter stop. The cost is missing the trades that move away without pulling back.
- Check one timeframe up. A 1-hour bullish pin with daily resistance just above it has little room to run.
- Count the room to the next level. If the nearest opposing level is closer than 1R, the trade does not pay enough for its risk.
Pre-trade pin bar checklist
- The candle has closed and passes points 1-6 of the identification checklist.
- There is at least 1R of room between your entry and the next opposing level.
- Your stop sits beyond the tail, with a buffer at least as wide as the spread.
- Your lot size is worked out from the stop distance, not the other way round.
FAQ
Should I enter a pin bar at the close or wait for the break of its high?
Entering at the close gives you a better price and a smaller stop, but no confirmation that the rejection will hold. A buy stop at the high, as in the EURUSD setup, only fills if price confirms, at the cost of a worse price and a wider stop. A 50% limit entry gives the tightest stop but misses trades that never pull back. Pick one method and use it every time, so your results stay comparable.
Does the colour of a pin bar's body matter?
A little. A bullish pin that closes above its open, like the EURUSD example, shows buyers ended the candle in control. A bullish pin with a red body can still be valid if the shape and level are right, but it is slightly weaker.
How long does a pin bar signal stay valid?
Set a time limit before you place the order. If price has not broken the pin's high (or the low, for a bearish pin) within three candles, treat the setup as stale and cancel the order.