









How to Read Candlestick Charts: Bodies, Wicks and Shapes Explained
To read a candlestick chart, treat each candle as a summary of one period built from four prices: the open, the high, the low and the close. The thick body runs from open to close. It is green (or hollow) if price closed higher and red (or filled) if it closed lower. The thin wicks mark the highest and lowest prices reached. Then read candles as a group, never one at a time.
This matters because many costly beginner mistakes on charts come from misreading candles. Common examples are acting on a candle that hasn't closed yet, or treating one shape as a prediction. Once you can read a candle correctly, you can avoid both.
What the four prices inside every candle mean
Every candle covers one fixed period, such as one minute, one hour or one day. During that period, price moves around. The candle keeps only four numbers from all that movement, known as OHLC:
- Open: the first price of the period.
- High: the highest price traded during the period.
- Low: the lowest price traded during the period.
- Close: the last price of the period.
On a forex chart, those prices are usually built from the Bid price, which is the price you can sell at. Keep that in mind. It matters when you place stops, as the misreads section further down explains.
How to read the body and wicks of one candle
The body covers the distance between the open and the close. The wicks (also called shadows) stretch from the body up to the high and down to the low.
The colour tells you which end of the body is the open. On a green candle the period closed above its open, so the open is at the bottom of the body. On a red candle it closed below its open, so the open is at the top. Some charts use the traditional Japanese style instead: a hollow candle means the close was above the open, and a filled candle means it was below. Most platforms let you change these colours, so check your chart settings once.
The drawing below puts a green candle and a red candle side by side. They have the same high, the same low and the same body size. Only the open and close swap places.
This is why traders prefer candles to a line chart. A line chart joins closing prices only. A candle also shows whether that period went up or down and how far price travelled before it settled.
Once you know the parts, three questions read any single candle:
- How big is the body? A long body means one side pushed price steadily in one direction. A small body means the open and close ended up close together.
- Where are the long wicks? A long upper wick means price went up and was pushed back down. A long lower wick means price fell and was bought back up.
- Where did it close within its range? A close near the high means buyers held control at the end. A close near the low means sellers did.
Which timeframe to read candles on
The reading rules are the same on every timeframe. A 5-minute candle and a daily candle are built the same way. The only difference is how much time each one covers. Lower timeframes print many more candles, so single shapes there are more often noise; shapes on the 1-hour chart and above carry more weight.
It helps to know that larger candles are just smaller ones merged together. Say four 15-minute candles make up one hour. The first opens at 1.1000 and the last closes at 1.1012. The highest high among them is 1.1020 and the lowest low is 1.0995. The 1-hour candle is then open 1.1000, high 1.1020, low 1.0995, close 1.1012. So a frightening 15-minute candle can be just a wick on the 1-hour chart.
That leads to a simple rule. Decide direction on a higher timeframe, then time your entry on a lower one. A common pairing:
| Trading style | Read direction on | Time entries on |
|---|---|---|
| Day trading | 1-hour | 5-minute or 15-minute |
| Swing trading | Daily | 4-hour |
| Position trading | Weekly | Daily |
Four candle shapes to learn first
A few single-candle shapes come up again and again. Each one describes what happened inside its period. None of them predicts the next move on its own. The drawing below shows all four.
| Shape | What it looks like | What it tells you | What it does not tell you |
|---|---|---|---|
| Marubozu | Full body, no wicks (a "shaved" candle) | The open sat at one extreme of the period and the close at the other, so one side controlled the whole period | That the move will continue |
| Spinning top | Small body, long wicks on both sides | Indecision: neither buyers nor sellers kept control | Which way price will break |
| Doji | Open and close at almost the same price, forming a cross | A standoff between buyers and sellers, with no direction of its own | Anything useful without the candles around it |
| Hammer | Small body near the top, long lower wick | Sellers drove price down, then buyers pushed it back up near the open. After a downtrend, it hints at a possible turn up | A confirmed reversal. The next candle has to agree |
How to read a group of candles: trend, range or turning point
Single candles answer "what happened this period". A group of candles answers the question you actually trade on: is the market trending, moving sideways, or possibly turning?
- Trend: each close steps beyond the last. In an uptrend you see mostly green bodies, higher highs and higher lows, and small wicks against the move. A downtrend is the mirror image.
- Consolidation (range): small bodies overlap each other, wicks stick out on both sides, and price keeps coming back to the same middle area.
- Possible turning point: after a clear move, a long wick appears against that move, such as a long lower wick at the bottom of a fall. Then the next candle closes the other way.
The context changes what a shape means. A doji in the middle of a range is just noise. A doji after a long run of big green bodies tells you the buying has stalled, and that is worth watching.
Two candles can also be read together. A bullish engulfing candle is a green candle whose body is bigger than the body of the red candle before it and covers that body completely, top to bottom. The same shape can also fail, so the context and confirmation steps below still apply.
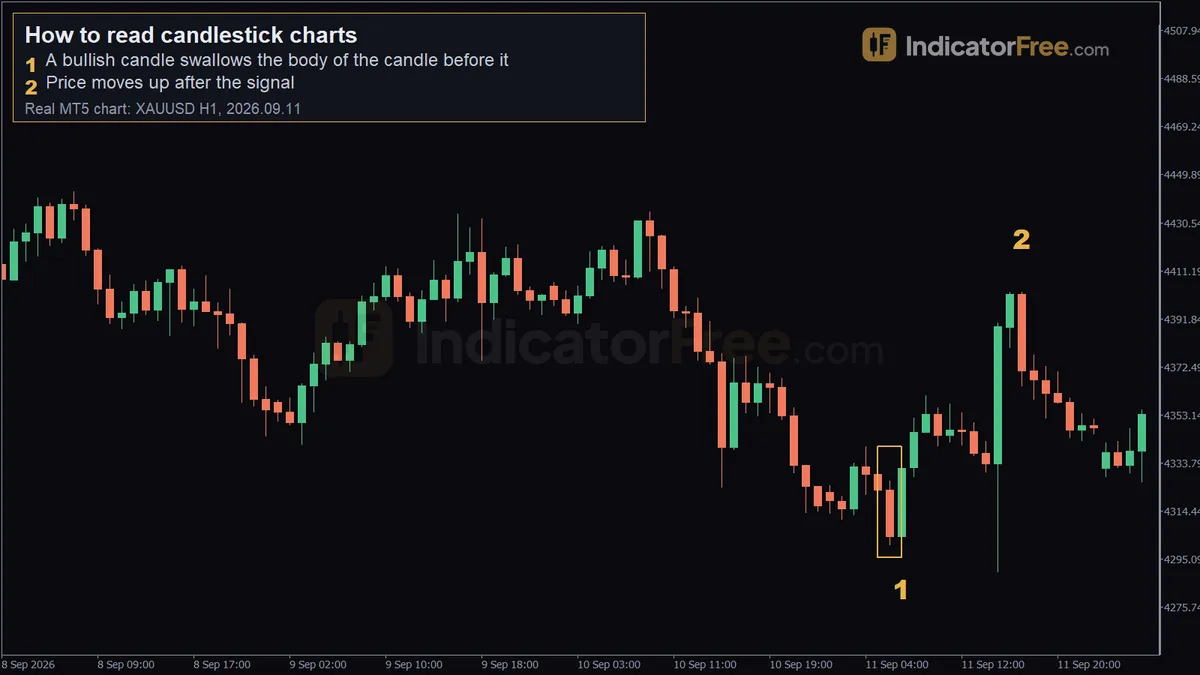 Real XAUUSD H1 chart from MetaTrader 5, a past example, not a forecast. 1 - a bullish candle swallows the body of the candle before it; 2 - price moves up after the signal.
The chart above is a past example, not a prediction. Marker 1 is the 1-hour candle of 2026.09.11 07:00. It opened at 4303.98, dipped to 4302.03, rose to 4335.35 and closed at 4331.75, and its body covers the body of the candle before it. Over the next 10 candles price moved 70.89 higher. Marker 2, at 17:00 the same day, shows price at 4402.64.
A 30-second routine to read any candlestick chart fast
Run these steps in this order every time you open a chart:
- Check the higher timeframe. Is it trending up, trending down or moving sideways?
- Mark the last clear high and low on your trading timeframe. These are the edges price is reacting to.
- Ignore the candle that is still forming. Until it closes, its body and wicks can still change completely.
- Read the last closed candle. Look at its body size, its wick lengths and where it closed within its range.
- Ask where it sits. A shape at a marked high or low, or at the end of a long move, matters. The same shape in the middle of nowhere usually doesn't.
- Wait for the next candle to confirm. If it closes beyond the signal candle's high (for a bullish shape) or low (for a bearish one), you have a signal. If it doesn't, you have nothing.
Worked example: reading a hammer step by step
The prices below are an illustrative example on a 1-hour EUR/USD chart, chosen to keep the maths easy. Twelve candles step down from an open of 1.1120 to a close of 1.1000, and most of them are red. The thirteenth candle opens at 1.1000, falls to 1.0960, climbs to 1.1020 and closes at 1.1015. The candle after it closes at 1.1030.
Context first. The hammer appears after a clear fall, which is the only place a hammer is worth reading. The same candle in the middle of a range would mean little.
Then measure the candle. A working test for a hammer: the lower wick should be at least twice the body, and the upper wick should be small. On EUR/USD, one pip is 0.0001. The calculation below takes the example prices and works through each measurement.
The lower wick is 40 pips, more than twice the 15-pip body. The upper wick is only 5 pips, so the close sits 5 pips below the top of a 60-pip range. Sellers pushed price 40 pips below the open, and buyers took all of it back and closed the candle 15 pips above the open. The shape passes.
Then wait. On its own, the hammer is only a hint. The next candle closes at 1.1030, above the hammer's high of 1.1020. That close is the confirmation, so the read is valid. Had it closed back below 1.1000, the hammer would have failed and you would have lost nothing by waiting.
Finally, find where you are wrong. If price trades back below the hammer's low of 1.0960, the buyers who made the hammer have lost. So a stop would sit beyond 1.0960. From the 1.1030 confirmation close, that is 70 pips away, which is the last line of the calculation above. Because the chart is drawn from bid prices, those 70 pips are measured on the bid, and the spread comes on top, as the misreads section below explains. That is much further than the 15-pip body might make you think, and it should shape how small your position is.
Common candlestick misreads and how to spot them
Misread: "My stop was hit, but no wick reached it." How to spot it: the trigger price sat just beyond a wick, closer than the spread. Your candles are usually drawn from the bid price, but buy orders fill at the Ask price, which sits slightly higher. The gap between the two is the Bid-ask spread. The stop on a sell trade is a buy order, so it triggers on the ask and can be hit even though the chart never printed a new high. The same goes for a Buy stop entry order: it can fill even though no candle touched your price. Fix: place stops and entry orders beyond the wick plus the spread.
Misread: acting on a hammer that hasn't closed yet. How to spot it: the candle's period is still running. A 1-hour candle can look like a perfect hammer at minute 40 and close as a plain red candle. Fix: make decisions only on closed candles. Step 3 of the routine exists for this reason.
Misread: calling a hanging man a hammer. How to spot it: the candles before it went up, not down. A hanging man has the same shape as a hammer: a small body near the top and a long lower wick. The difference is where it appears. It comes after a rise, and there it warns that sellers pushed price down hard during the period. Fix: before you name the shape, look at the candles before it. After a fall it is a hammer; after a rise it is a hanging man.
Misread: daily candles that look different between brokers. How to spot it: the same pair shows a different daily shape on two charts. A daily candle opens and closes at a set hour, and different platforms and brokers start the day at different times. That shifts which prices fall into each daily or 4-hour candle. Fix: read the candles on the platform you actually trade on.
Misread: reading a shape without its context. How to spot it: you can't say where the shape sits. A hammer in the middle of a range or a doji inside a quiet sideways market tells you very little. Fix: before you name a shape, say where it sits: at a marked high or low, at the end of a long move, or nowhere special. If it is nowhere special, skip it.
Misread: panicking over a big lower-timeframe candle. How to spot it: you are watching a 1-minute or 5-minute chart while your trade is planned on the 1-hour. Fix: check the candle on the timeframe your trade is based on. As the 15-minute merge example showed, a candle that looks alarming on a small timeframe can be just a wick on the larger one.
How to Read Forex Charts: Candlesticks, Trends and TimeframesNext lesson →
What Is a Fair Value Gap in Forex? How to Spot and Trade One
Part of Price action & SMC: more guides, terms and free tools on this subject.