









What Is a Fair Value Gap in Forex? How to Spot and Trade One
A fair value gap (FVG) in forex is a price zone that a fast move left behind on the chart. You find it with three candles in a row. If the high of the first candle and the low of the third candle don't overlap, the empty space between them is the gap (in a falling market, compare candle 1's low with candle 3's high).
This matters because many traders plan entries around these zones. Beginners lose money in two ways: they mark gaps that aren't there, or they chase the fast move that created the gap. Once you know the three-candle rule, you can avoid both mistakes on any forex chart.
How to identify a fair value gap in three steps
You only need three candles and their wicks. Follow this order:
- Find the big candle. Look for a candle that moved much further than the candles around it. This is candle 2, the middle candle.
- Look either side of it. Check the candle just before it (candle 1) and the candle just after it (candle 3). Measure from their wicks, not their bodies.
- Check for a gap. For a bullish FVG, candle 1's high must be below candle 3's low. Mark the zone between those two prices. For a bearish FVG, candle 1's low must be above candle 3's high. Mark the zone between them.
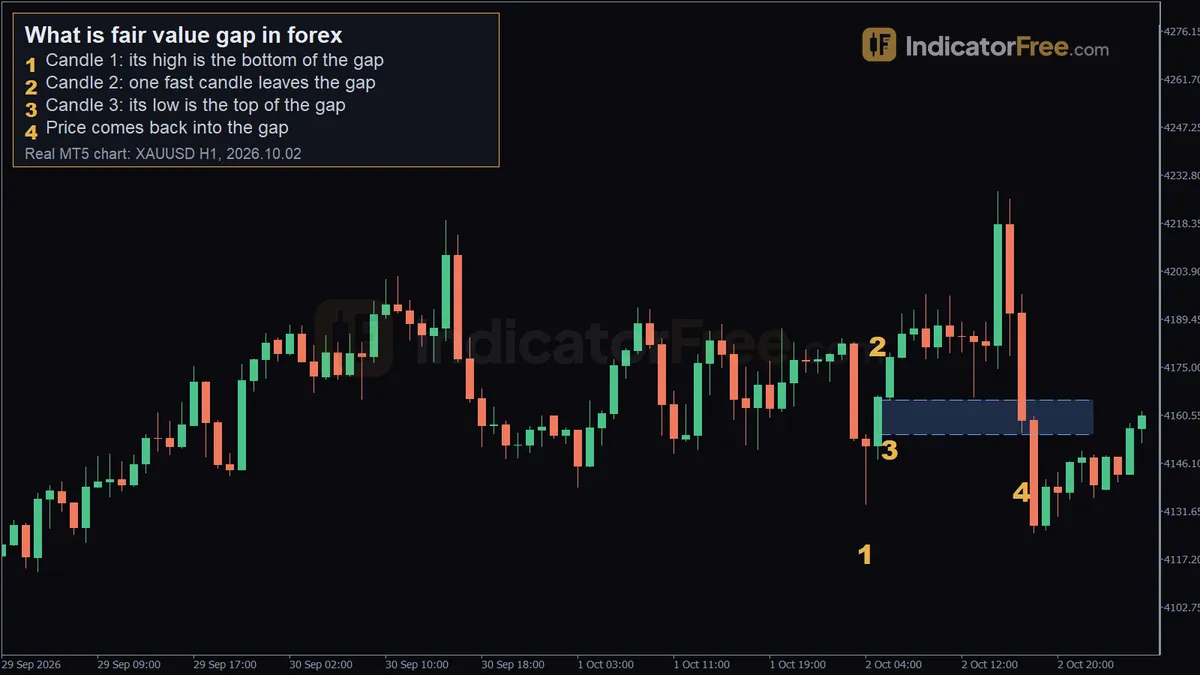 Real XAUUSD H1 chart from MetaTrader 5, a past example, not a forecast. 1 - candle 1: its high is the bottom of the gap; 2 - candle 2: one fast candle leaves the gap; 3 - candle 3: its low is the top of the gap; 4 - price comes back into the gap.
The chart above is a past example on a 1-hour chart of gold quoted against the US dollar (XAU/USD), which many forex brokers list next to the currency pairs. Marker 1 sits on the 2026.10.02 04:00 candle, near 4133.79; that candle's high, 4154.75, is the bottom of the gap. Marker 2 is the 05:00 candle, which ran up to 4166.5 in one go. Marker 3 is the 06:00 candle; its low, 4165.13, is the top of the gap. So the gap runs from 4154.75 to 4165.13, which is 4165.13 − 4154.75 = 10.38 in price. Marker 4 shows price coming back at 17:00 the same day to 4155.43, inside the gap near its bottom edge. The rule reads exactly the same on a currency pair, as the EUR/USD worked example later in this lesson shows.
The drawing below shows both versions. The shaded band is the fair value gap. Candle 2 cuts straight through it, which is exactly why the gap exists.
The three candles don't have to be the same colour. In the bullish example, candle 1 is red. A bullish FVG can start with a down candle, and a bearish one can start with an up candle. Only the position of the wicks counts.
When price comes back into the gap, traders say it is being filled, or mitigated. Traders don't all agree on when a gap is finished. This lesson uses one common convention: a wick that pokes into or through the gap does not end it, but once a candle closes beyond the far edge (below the bottom of a bullish gap, or above the top of a bearish one), the gap is treated as used up and no longer a zone for new orders. Some traders instead count a full wick fill as mitigation. Pick one rule and apply it the same way every time.
Why the gap appears: an imbalance between buyers and sellers
Price usually moves one level at a time, and buyers and sellers both trade at each level. Now suppose a burst of buy orders hits the market, for example after surprise news. Price jumps so fast that two-sided trading never happens at many of the prices inside the big candle.
Price moved through those levels almost entirely one way: buyers took every offer and sellers had no time to push back. That one-sided stretch is why traders call it an imbalance. The market is treated as inefficient there until price trades back through it, so many traders expect price to return.
Which timeframe to use for fair value gaps
The three-candle rule works the same on every timeframe. "The candle" just means a candle on whatever chart you're looking at. What changes is how many gaps you see and how much each one matters.
Higher timeframes, like the 4-hour or daily chart, produce fewer and larger gaps, made by bigger moves. Lower timeframes, like the 5-minute or 1-minute chart, produce many small gaps. On those, more of the gaps are noise, and the bid-ask spread takes up a bigger share of each gap.
A practical approach is to find the gap and the trend on a higher timeframe, then move to a lower one to time your entry. For example, go from the 4-hour chart to the 1-hour, or from the 1-hour to the 15-minute. If you can check the chart only a few times a day, use the 4-hour chart for the gap and the 1-hour chart for entry. Pick one higher/lower timeframe combination and stick with it, so you're always judging gaps the same way.
What does not count as a fair value gap
Three patterns get mistaken for FVGs. Learn them early, because each one leads to trades built on a zone that doesn't exist.
- Overlapping wicks. A big candle alone is not enough. If candle 3's low dips back to or below candle 1's high, there's no empty space and no FVG.
- A liquidity void. This is a longer one-way run with little opposing trading that spans more than three candles. The void is the whole run, and it can contain several FVGs inside it. An FVG is strictly a three-candle pattern, so don't use the two terms as if they meant the same thing.
- A weekend or session gap. A jump between Friday's close and Monday's open is a price gap between two candles, not a three-candle FVG. Only mark it if candle 1 and candle 3 of a three-candle sequence leave the space.
The first two cases are drawn below. Compare the left panel with the bullish pattern above: the big candle looks the same, but the wicks of candles 1 and 3 touch.
A common misread to watch for: drawing the zone from candle bodies instead of wicks. Bodies often leave a visible space even when the wicks overlap. If you zoom in and the wicks touch, there's no gap.
Fair value gap vs order block: how they fit together
These two terms come up together in Smart Money Concepts (SMC) lessons, a style of chart reading built around where large institutions place orders. Beginners often mix them up. The table compares them on the same points.
| Fair value gap | Order block | |
|---|---|---|
| What it marks | The unfilled zone created during the fast move | The last opposite-colour candle before the fast move (the last down candle before a rally, the last up candle before a drop), where strong buying or selling came in |
| Number of candles | Exactly three | Usually one candle, or a small cluster |
| Where it sits | Inside the impulse | At the base of the impulse |
| How it's drawn | Candle 1 wick to candle 3 wick | Commonly the high to the low of that candle |
An order block and an FVG often sit right next to each other. In a bullish move, the order block is usually just below the gap. When the two stack like this, many traders treat the combined area as one zone to watch. The worked example below shows exactly this setup.
How traders use a fair value gap to plan a trade
An FVG doesn't tell you to buy or sell the moment it appears. It marks a zone where you might act later. The usual plan has five parts.
- Trade in the direction of the move. A bullish FVG in an uptrend is where you look for a long position. A bearish FVG in a downtrend is where you look to sell. Don't use a gap to bet against the move that created it.
- Expect a retrace. The plan assumes price comes back into the gap, either part of the way or all the way, and then continues in the original direction.
- Choose your entry level in advance. The near edge of the gap is closer to price, so it is more likely to be reached, but it gives you a worse entry. The far edge gives a better entry but is less likely to be reached. The 50% midpoint is called Consequent Encroachment (CE). In a healthy trend, price can react at the midpoint without filling the whole gap, which is why many traders use it as a middle ground.
- Get a second opinion. Traders often confirm an FVG with another tool, such as RSI, a moving average or a trendline.
- Put the stop beyond the swing and set a target. Place the stop past the swing low (for a buy) or the swing high (for a sell). A common target is 2 to 3 times the distance to the stop, which is a 2:1 to 3:1 reward-to-risk ratio.
So when a new gap appears, such as your first bearish FVG, check it against the higher-timeframe trend. If the gap points against that trend, skip it. If it points with the trend, it becomes the zone where you set a limit order.
These rules tell you what to do next.
Before you enter:
- If price never comes back, you have no trade. Don't chase it.
- If a candle closes beyond the far edge before you enter (below the bottom of a bullish gap, or above the top of a bearish one), the zone is used up under the close rule described earlier. Don't place an order there.
After your order is filled:
- If price retraces into the gap and holds, the plan is on track. Let the trade work.
- If price fills the whole gap, that alone is not an exit. The trade is only wrong when the stop beyond the swing is hit.
Worked example: a bullish FVG trade on EUR/USD
The prices and account size here are an illustrative example. The chart is a 1-hour chart of the EUR/USD currency pair, and the trading account holds $10,000.
On the 4-hour chart EUR/USD is making higher highs, so you only look for bullish gaps on the 1-hour chart. Price drifts sideways. Then one last bearish candle prints, ranging from 1.1008 to 1.1020. That's the order block. Next comes a large bullish candle, followed by a candle whose low is 1.1040.
Apply the rule. Candle 1's high is 1.1020 and candle 3's low is 1.1040. They don't overlap, so you have a bullish FVG from 1.1020 to 1.1040. On EUR/USD one pip is 0.0001, so the gap is 20 pips wide.
Your plan:
- Buy limit at the midpoint (CE), 1.1030.
- Stop at 1.1005, just below the swing low of 1.1008.
- Target at 2:1 reward-to-risk.
Next, work out the trade size before you place the order. For EUR/USD on a USD account, one standard lot is worth about $10 per pip.
Here's what happened. Three candles after the impulse, price touched the top of the gap; two candles later it dipped to 1.1029, filling your order at the midpoint. Price never reached the bottom edge at 1.1020, which is the CE behaviour described earlier. Then it climbed. Five candles after the fill, the candle marked "Target hit" reached the 1.1080 target (its high was 1.1082), and the trade closed there.
The result: 1.1080 − 1.1030 = 0.0050, which is +50 pips. At 0.40 lots that is 50 × $10 × 0.40 = +$200, twice the $100 you risked, so the trade made 2R.
The same plan could just as easily have hit the stop. If price had kept falling through 1.1005, you would have lost 25 pips: 25 × $10 × 0.40 = −$100, which is −1R. That is what a 2:1 plan means across many trades: each win adds 2R and each loss takes away 1R. In the same example, one win and two losses leave you at +$200 − $100 − $100 = $0, so you need more than one win in every three trades just to come out ahead.
What you're learning here is the process: mark the gap, pick the entry, place the stop, size the trade and set the target, all before price comes back.
Mistakes that cost beginners money with fair value gaps
Putting the stop just inside the gap. Price often pushes deep into the gap before it turns, so a stop inside the zone gets hit even when your idea was right. Fix: put the stop beyond the swing low or swing high, then make your position smaller to fit the wider stop.
Chasing the fast candle. The big middle candle looks like the trade, so beginners buy at its top. That puts you far from any stop that makes sense. Fix: wait for price to come back to the gap with a buy limit or sell limit order. If it never returns, you have no trade.
Trading every gap you see. On a 1-minute chart, gaps appear constantly, and many point against the bigger trend. Fix: take only gaps that point the same way as the higher-timeframe trend, and skip the rest.
Sizing the trade by feel. A clean-looking gap tempts you to trade bigger. One stop-out then wipes out several wins. Fix: work out the lot size from your stop distance and a fixed share of your account, as in the worked example, and practise the whole routine on a demo account before you use real money.
FAQ
Why does my FVG indicator show fewer gaps than I mark by hand?
Most fair value gap indicators have a minimum-gap-size filter, so small gaps are not drawn. Many also remove or fade a zone once price has filled it. Fewer boxes doesn't mean the hidden gaps are invalid. It means they fall below the size you set, or they are already used up.
What does liquidity have to do with a fair value gap?
The fast move behind the gap left buy or sell orders unfilled across that price range. Traders see those levels as an area where orders are still waiting, which is one reason they expect price to come back and trade through the zone.
How to Read Candlestick Charts: Bodies, Wicks and Shapes ExplainedNext lesson →
What Is Fundamental Analysis? How News and Data Move Currencies
Part of Price action & SMC: more guides, terms and free tools on this subject.