









Smart money concepts
Also called SMC, Smart money trading
Smart money concepts (SMC) is a price action method that tries to follow large players by reading liquidity, breaks of market structure and order blocks. You trade from the zones where those players are thought to have placed orders.
SMC aims to give you a defined entry price instead of chasing a move halfway through. It also gives you a clear point where the idea is wrong. That second part protects your money: if price closes through the zone, you leave with a small loss you knew about in advance.
The SMC vocabulary you need before marking a chart
A swing high is a candle high with lower highs on both sides. A swing low is the mirror image. Traders park stop orders just beyond these points, so SMC calls them liquidity: a pool of orders that big players can fill against.
A liquidity sweep happens when price spikes past a swing point, triggers those stops, then turns back. It often comes just before the real move.
A break of structure (BOS) is a candle that closes beyond the last swing high in an uptrend, or the last swing low in a downtrend. It confirms the trend. A change of character (CHoCH) is the first break against the trend. It is an early sign of a reversal.
An order block is the last opposite-colored candle before the strong move that caused the break. Displacement is that strong move: big candles that barely overlap. A fair value gap (FVG) is a three-candle gap. In a bullish gap, the first candle's high and the third candle's low do not touch. In a bearish gap, the first candle's low and the third candle's high do not touch.
How to spot a valid SMC setup: a 7-step checklist
- Read the trend on a higher timeframe, such as the 4-hour or daily chart: higher highs and higher lows, or lower highs and lower lows.
- Mark the obvious liquidity: equal highs, equal lows and clear swing points.
- Wait for a sweep of that liquidity, or for a sharp move away from a level.
- Confirm a break of structure (or a change of character, for a reversal). A candle body must close beyond the last swing point. A wick alone does not count.
- Mark the order block: the last opposite candle before the displacement, from its high to its low. In a bearish setup this is the last up candle, and your stop goes above its high.
- Wait for price to come back to the zone. Do not chase the breakout.
- Before you place the order, check that price has not come back to the zone since it formed, that a buy zone sits in the lower half of the latest swing (a sell zone in the upper half), that the stop is beyond the zone's far edge, and that the lot size fits your risk.
The chart below shows the full sequence: stops swept under a prior low, the last bearish candle, a close above the last swing high, and the pullback into the zone. Before the break, the highs and lows were falling, so that first close above the last swing high is a change of character. The next close, above the older external high, is a break of structure in the new direction. A reversal setup starts with a CHoCH; later breaks in the new direction are breaks of structure.
What makes an SMC zone weak or broken
A zone is weak when the break of structure came from a wick only. No candle body closed beyond the swing point, so structure has not really changed.
It is also weak when the move away was slow and choppy. Without displacement, nothing suggests that large orders sat there.
A zone that price has already revisited once is weaker on the next touch, because the orders resting there may already be filled. A zone that points against the higher-timeframe trend is a lower-quality trade too.
The zone is broken when a candle closes through its far edge. For a buy zone, that is a close below its low. At that point the idea is invalid, so you exit rather than move the stop.
One more filter is premium and discount. Split the latest swing in half. For buys, you want the zone in the lower half (discount). For sells, you want it in the upper half (premium). A buy zone sitting near the top of the range offers little room to the target.
Reading the EURUSD 1-hour example marker by marker
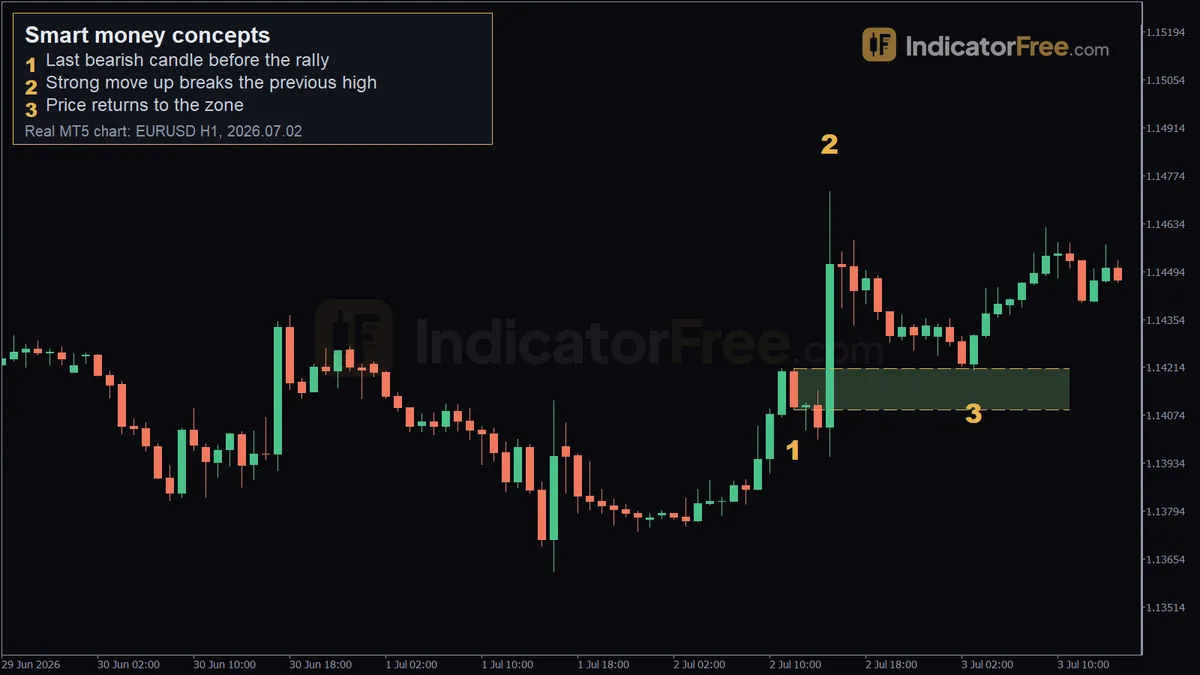
The chart at the top of this page is a past EURUSD 1-hour example, not a prediction.
Marker 1. The bearish candle that closed at 12:00 on 2 July 2026 stopped the earlier rise. Its range sets the zone: 1.14090 to 1.14211, about 12 pips tall.
Look closely and you will see the 14:00 candle is also bearish, and it closed at 1.14040, below the zone low. That does not break the zone, because there is no zone yet. A range only becomes an order block once displacement breaks structure away from it, so closes before the break do not count. The "closes through its far edge" rule applies only after that.
Why mark 12:00 and not 14:00? The 13:00 and 14:00 candles are small, overlapping candles inside the same pause, and this example takes the down candle that started that pause. Some traders would mark the 14:00 candle instead, from 1.14004 to 1.14147. The pullback low at 1.14206 never reached that lower zone, so that choice would have missed this trade. Pick one rule and apply it every time.
Marker 2. Over the next three candles, price moved 43 pips and broke the 10-bar high. At 15:00 the rally stood at 1.14727. That is the displacement. Before 12:00 the candles had already risen from about 1.1377 to about 1.1421, so this is a break of structure in an uptrend, not a change of character. The break turns the bearish candle from marker 1 into a valid order block.
Marker 3. At 03:00 on 3 July 2026, price came back to 1.14206, just inside the zone, then moved 42 pips up.
The detail most people miss: the pullback only reached 1.14206, half a pip inside the top edge at 1.14211. A limit order at the middle of the zone would never have filled. Decision rule: if the zone is narrow, put your limit at the near edge. If it is wide, use the midpoint and accept that some trades will leave without you.
Planning entry, stop and target on the EURUSD zone
The numbers in this section are an illustrative example built on the real prices above.
Entry and stop loss
You place a buy limit at 1.14206. The zone low is 1.14090, and you put the stop a few pips below it to allow for spread and a small wick. With that buffer, the stop is 15 pips from entry. With a $6,000 account and 1% risk, the sizing works like this:
Choosing the target
SMC traders often aim for the next pool of liquidity, which here is the break high at 1.14727. That is about 52 pips above the entry. The actual move was about 42 pips, so that target was never reached.
The 2-to-1 target sat 30 pips above entry and was inside the move. A practical rule: take part of the position off at 2 times your risk, then let the rest run toward the liquidity with the stop moved to entry.
When smart money concepts work and when to stand aside
SMC reads best in trending markets with clean swings, where sweeps and breaks are easy to see. It also works best when the zone lines up with the higher-timeframe trend.
Stand aside before high-impact news, when a spike can run through any zone. Avoid tight ranges, where every small swing looks like a break. Be careful in thin holiday trading too.
| Pros | Cons |
|---|---|
| Gives an exact entry and a clear invalidation level | Labels are subjective; two traders mark different zones |
| Small stops relative to targets | Limit orders deeper in the zone (midpoint or far edge) often miss the move |
| Works on any market with a chart | Hard to judge without many logged examples |
| Forces you to wait for confirmation | Easy to see zones everywhere in hindsight |
Practical tips for trading smart money concepts
- Write your rules before the session. Decide on the wick or body, edge or midpoint, and the stop buffer. This stops you from redrawing zones to fit a trade you want.
- Use one higher timeframe for direction and one lower timeframe for zones. More than that creates conflicting signals.
- Cancel the limit order if price reaches your target first. If the move runs to the next liquidity without returning to the zone, the setup is spent.
- Check the reward before you place the order. If the distance from entry to the next liquidity is less than 2 times your stop, skip the trade.
- Set a price alert at the zone edge. You wait for the return without staring at the chart and talking yourself into an early entry.
FAQ
Do banks really trade from order blocks?
No retail trader can see where institutions place their orders. SMC is a set of labels for repeated price behavior, not inside information. Judge it by your own logged trades.
Which timeframe should a beginner use for SMC?
Read the trend on the 4-hour or daily chart and mark zones on the 1-hour. Lower charts such as the 5-minute show many more false breaks and zones.
Can I combine smart money concepts with indicators?
Yes. A fixed, rule-based definition of a swing, for example a high with a set number of lower bars on each side, removes the guesswork about which high counts, whatever tool marks it. Keep the final decision on price itself.