









Equal highs
Also called EQH, Relative equal highs, Equal highs liquidity
Equal highs are two or more swing highs that top out at almost the same price. Many traders set stop losses and buy orders just above them, so the level often gets tested or briefly broken.
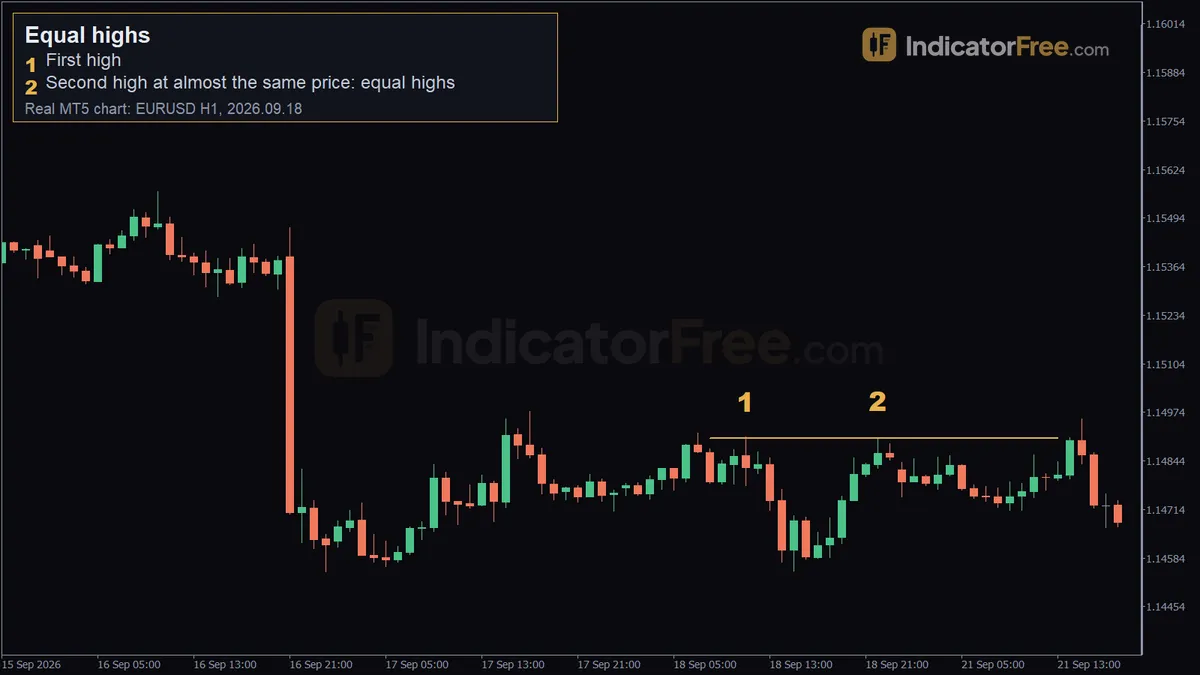
If you sell just under equal highs with a tight stop, your stop is one of the orders that gets filled. Traders who sold at the two tops tend to put their stops in the same spot, and breakout traders put buy orders there too. That cluster is what larger orders need, so the first move through the level is often a grab, not a breakout.
How to spot equal highs: a 6-point checklist
A swing high is a candle whose high sits above the highs of the candles on both sides of it. Equal highs are built from swing highs, so find those first.
- Two or more swing highs. Each one must be a clear peak, not a candle in the middle of a move.
- Tops within a tight tolerance. As a rule of thumb, the gap between the highs should be smaller than about one-tenth of an average candle on that timeframe. For example, if candles on your chart average 20 pips from high to low, tops within about 2 pips count as equal.
- A real pullback between them. You should see a visible dip and several candles between the peaks, not two candles side by side.
- Measure wicks, not closes. The orders sit above the highest traded price, so the wick tip is what counts.
- Visible on your trading timeframe. If you have to zoom in to see the level, most other traders won't be watching it.
- Still untouched. No candle has traded above the level since the second high formed.
Strong, weak and broken equal highs
Strong equal highs are obvious. They come with a clean pullback between them, sit on the 1-hour chart or higher, and nothing has touched them yet. The more traders can see the level, the more orders build up above it.
Weak equal highs show up inside tight, choppy price action, where matching tops are often just market noise. They are also weak when only one or two candles separate the peaks, or when a wick has already poked above one of them and taken part of the orders.
The level is broken once a candle closes above it and the next candles stay above. After that, it's no longer liquidity waiting to be taken. It's old resistance that price may come back to retest.
A common misread: if the second peak clears the first by more than your tolerance, it's a higher high, not an equal high. A higher high means buyers are still pushing the trend up. Equal highs show the opposite: buyers reached the same ceiling twice and couldn't get past it.
Reading the EURUSD equal highs from 18 September 2026
The chart at the top of the page shows a past example on the EURUSD 1-hour chart. It is not a forecast.
- Marker 1, the first high: 11:00 on 2026.09.18, at 1.14908.
- Marker 2, the second high: 22:00 the same day, at 1.14904.
The gap is 1.14908 − 1.14904 = 0.00004. That's 0.4 of a pip, so it rounds to 0 pips. The two peaks are 11 hours apart (10 one-hour candles between them). That is enough time for a pullback to form between them; check on your own chart that the dip is visible.
A trader looking at this chart would draw a line at 1.14908, the higher of the two highs, and expect stops to be resting just above it. The chart alone doesn't show which way price goes next. You trade the reaction at the line, not the line itself.
Two ways to trade equal highs
Both setups below use one illustrative example on a EUR/USD-style chart. The equal highs and the pullback low between them are 50 pips apart.
Setup 1: sell the sweep above equal highs
In the chart below, the 4th and 10th candles both top out at the same price, marked by the Equal highs line. Later, a candle spikes 12 pips above the line, fills the orders resting there, and then closes back below it, 6 pips under the line. That close back under the line is your entry trigger.
- Entry: sell at the sweep candle's close, 6 pips under the line.
- Stop loss: 7 pips above the sweep high. The sweep high is 18 pips above your entry, so that puts 25 pips of risk on the trade.
- Target: the pullback low between the two highs. That's 44 pips away.
The calculation below sizes this trade for a $10,000 account risking 1%. It uses the textbook pip value of $10 per pip for a 100,000-unit lot on a USD-quoted pair.
Setup 2: buy the break and retest of equal highs
The drawing below shows the other outcome. A candle closes above the equal highs line and price stays there. You wait for price to pull back to the old ceiling. If the pullback holds above it, the orders that sat above the level helped push price higher, and the old ceiling is now acting as a floor.
- Entry: buy on the retest, 2 pips above the line.
- Stop loss: 15 pips below the line, back inside the old range. That's 17 pips of risk.
- Target: the range from the pullback low to the equal highs is 50 pips tall, so the target is 50 pips above the line. That's 48 pips from entry.
How to choose between the setups: if a wick goes above the line and the candle closes back below, look at Setup 1. If a candle closes above the line and the retest holds, look at Setup 2. If price closes above and then closes back below within a couple of candles, stay out. Both sides are getting trapped.
When equal highs work and when to skip them
Equal highs tend to be most useful in ranges and near the end of a long rally, on the 1-hour chart or higher. They also work better when the sweep happens in an active session with plenty of volume behind it.
Skip them in the minutes before high-impact news, when spikes can run both ways and take out both sides. Don't sell equal highs against a strong uptrend either. There, the level often gets taken and price keeps going.
| Pros | Cons |
|---|---|
| Easy to see on any chart | Many traders see the same line, so fake moves are common |
| Gives a clear place for your stop and target | A sweep and a real breakout look the same until the candle closes |
| Works in ranges and at trend turns | Weak in chop, where matching tops are just noise |
| Fits with order blocks and swing structure | Needs patience: a level can sit untouched for days |
The mirror image, equal lows, forms below price and has its own glossary entry.
Practical tips for trading equal highs
- Draw the line at the higher of the two highs. Otherwise you'll mistake a small poke above the lower one for a sweep.
- Never rest your own stop a pip or two above equal highs. Place it beyond the sweep high, or beyond the next swing high.
- Check the next timeframe up. Equal highs on the 1-hour chart that sit right under a daily resistance level are more likely to reject.
- A wick is not a breakout. Wait for the candle to close before you act.
- Re-size for each setup. On the same $10,000 account risking $100, Setup 2's 17-pip stop gives $100 ÷ (17 × $10) ≈ 0.59 lots, not the 0.40 lots from Setup 1.
- The cleaner and more obvious the equal highs, the more likely they get swept before price moves away.
FAQ
Do three or more equal highs make the level stronger?
They build a bigger pool of orders above the level, but each test can absorb sellers. If each touch rejects with a smaller drop than the one before, treat the level as likely to be taken.
How long do equal highs stay relevant?
Until price trades through them. Untouched equal highs on the daily chart can stay in play for weeks. Lower-timeframe ones usually lose their pull within a session or two.
Can I trade equal highs on a 5-minute chart?
You can, but many matching tops on very short charts are just noise. Use them for timing only when they sit near a level you can also see on the 1-hour chart.