









Swing low
Also called Pivot low, Swing point low, Swing bottom
A swing low is a candle whose low sits below the lows of the candles on both sides of it. It marks a turning point where selling stopped and price bounced, and traders use it as a floor for reading trend and placing stops.
On a buy trade, the stop loss usually sits just under a swing low. Whether the last swing low held or broke is also how most traders decide if a trend is still alive. If you mark the wrong point, your stop sits in the wrong place, or you call a trend change that never happened.
How to spot a swing low: a 6-step checklist
- Stay on one timeframe. A swing low on the 1-hour chart may not show up at all on the daily chart.
- Find the candle with the lowest low in its area. Use the wick, not the body.
- Check the left side. The two candles before it must have higher lows.
- Check the right side. The two candles after it must have higher lows, and both must have closed.
- Check the bounce. Price should move clearly away. A simple rule: a later candle closes above the high of the swing candle.
- Mark the level at the wick low. This is the price that must hold.
Two candles on each side is a common setting. Use more candles and you get fewer swing points, but each one matters more.
The most common misread comes from step 4. You can't confirm a swing low until two candles after it have closed. Traders who mark the lowest candle early often watch it disappear when the next candle trades lower. That delay is the price you pay for certainty.
In the chart below, A, B and C each have two higher lows on each side. B is a higher low: it sits above A, which tells you the uptrend is intact. In a downtrend the opposite happens: each swing low sits below the last one, a lower low, as in the EURUSD example further down. The mirror image at the top of a move is the swing high.
Strong, weak and broken swing lows
A strong swing low has a clear bounce, fits the trend, and lines up with structure on a higher timeframe.
A weak swing low has a shallow bounce inside a sideways range. It can also be one of several lows at almost the same price, where many stops cluster and make an easy target. Other weak cases: a single news-spike wick, or a low on a very small timeframe that goes against the bigger trend.
A swing low is broken when a candle body closes below it. That is a break of structure. If only the wick pokes below and the candle closes back above, the level has not broken. That is a liquidity sweep: price ran the stops and then rejected.
Decision rule: if a candle closes below the swing low, treat the level as gone. If the candle closes back above the level, it's a sweep, not a break. The level still stands.
Reading the EURUSD 1-hour example, marker by marker
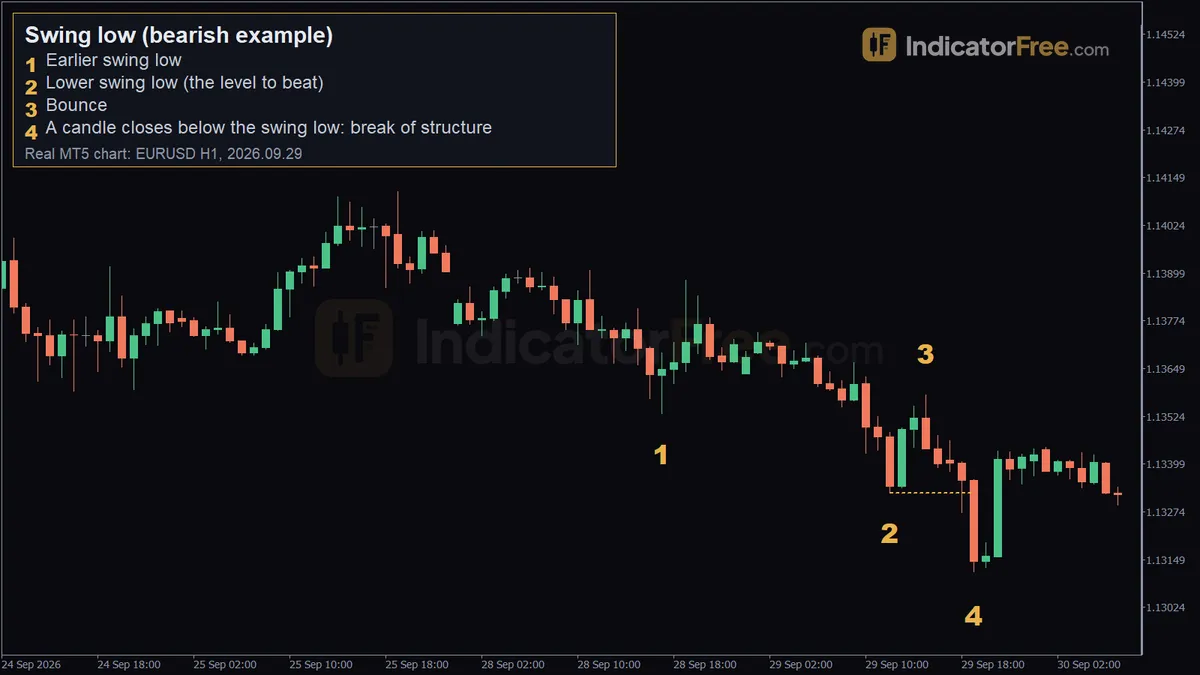
The chart at the top of this page is a past example, not a prediction.
- Marker 1 (28 September 2026, 17:00, 1.13532): the earlier swing low.
- Marker 2 (29 September 2026, 12:00, 1.13324): a new swing low 20.8 pips below the first one. A lower low is a bearish sign. This is the level to beat.
- Marker 3 (29 September 2026, 15:00, 1.13581): buyers pushed price 25.7 pips off the low, but the bounce faded.
- Marker 4 (29 September 2026, 19:00): this candle closed at 1.13145, 17.9 pips below the swing low. That close, not the wick, confirms the break of structure.
One candle earlier, the 18:00 candle dipped to 1.13272, 5.2 pips below the swing low, but it closed back above it at 1.13356. That was a sweep, not a break. The break was only confirmed when the 19:00 candle closed below the level.
What this example teaches: a lower swing low followed by a weak bounce left the floor exposed, and the close below it confirmed the break.
Trading setups built on a swing low
Buying a confirmed higher low in an uptrend
The figures here come from the candle chart above and are an illustrative example. Swing low B is confirmed when the second candle after it closes.
- Entry: at that confirming close.
- Stop loss: five pips under the wick of swing low B, which is 40 pips below the entry.
- Target: twice the risk, 80 pips above the entry.
Waiting for confirmation made the stop 40 pips wide. You get a level you can trust, but you have to trade a smaller position.
Selling the break of the EURUSD swing low
This uses the real prices from the top chart. The numbers show how you would plan the trade. They are not a record of what happened next.
- Entry: 1.13145, the close below the swing low.
- Stop loss: at the bounce high of 1.13581, which puts 43.6 pips at risk.
- Target: twice the risk (2 × 43.6 = 87.2 pips) below the entry.
In practice you would add a few pips of buffer above that high, because stops placed exactly on a swing point get hit first. The buffer means more risk per lot, so you trade a smaller position.
A tighter option is to wait for a retest. A retest means price climbs back up to the broken level at 1.13324, so the old floor now works as a ceiling. If you sell there, the same stop at the bounce high risks 25.7 pips before your buffer, and twice that risk puts the target 51.4 pips below the retest entry. The chart facts don't show whether a retest came, so this order might never have filled.
Buying a sweep under the swing low
Wait for a wick to go below the swing low and the candle to close back above it. Enter on that close. Put the stop under the wick's low and aim for the most recent swing high. This setup only makes sense when the bigger trend is up.
When swing lows work and when to avoid them
Swing lows are most useful in a clear trend, during active trading hours, when the higher timeframe points the same way. Skip them in tight sideways ranges, in the minutes around major news, and on very small timeframes during quiet hours. In those conditions, new lows form and break all the time and carry little meaning.
| Pros | Cons |
|---|---|
| Gives you a clear, objective place for the stop | Easy to see in hindsight, harder to judge at the live right edge |
| Shows the trend through higher or lower lows | Too many of them in choppy markets |
| Uses only price, so there are no indicator settings to tune | Marks a level, not a direction: it doesn't tell you where price goes next |
| One level serves both sides: buyers put stops under it, sellers wait for a close below it | Wide stops after big candles shrink your position |
Pre-trade checklist for a swing low trade
- Is there enough room to your target before the next swing high (on a buy) or the next swing low (on a sell)?
- Have you checked the current spread? When the spread widens, a stop sitting just past the swing low can get hit even if the chart price never quite reaches it.
FAQ
What is a swing point in trading?
A swing point is any turning point in price, either a swing high or a swing low. Traders link swing points together to read the trend and mark support and resistance.
Which timeframe should I use for swing lows in day trading?
Many day traders read structure on the 1-hour chart and time entries on the 5-minute or 15-minute chart. Lows on the smaller chart that go against the 1-hour trend count as weak.
Should I move my stop each time a new swing low forms?
You can trail your stop under each new confirmed higher low. This protects open profit, but don't move it before the swing low is confirmed, or a normal pullback can stop you out.