









Break of structure
Also called BOS, Market structure break, MSB, Structure break
A break of structure (BOS) happens when a candle closes beyond the last swing high in an uptrend, or the last swing low in a downtrend. It confirms that the trend has started a new leg in the same direction.
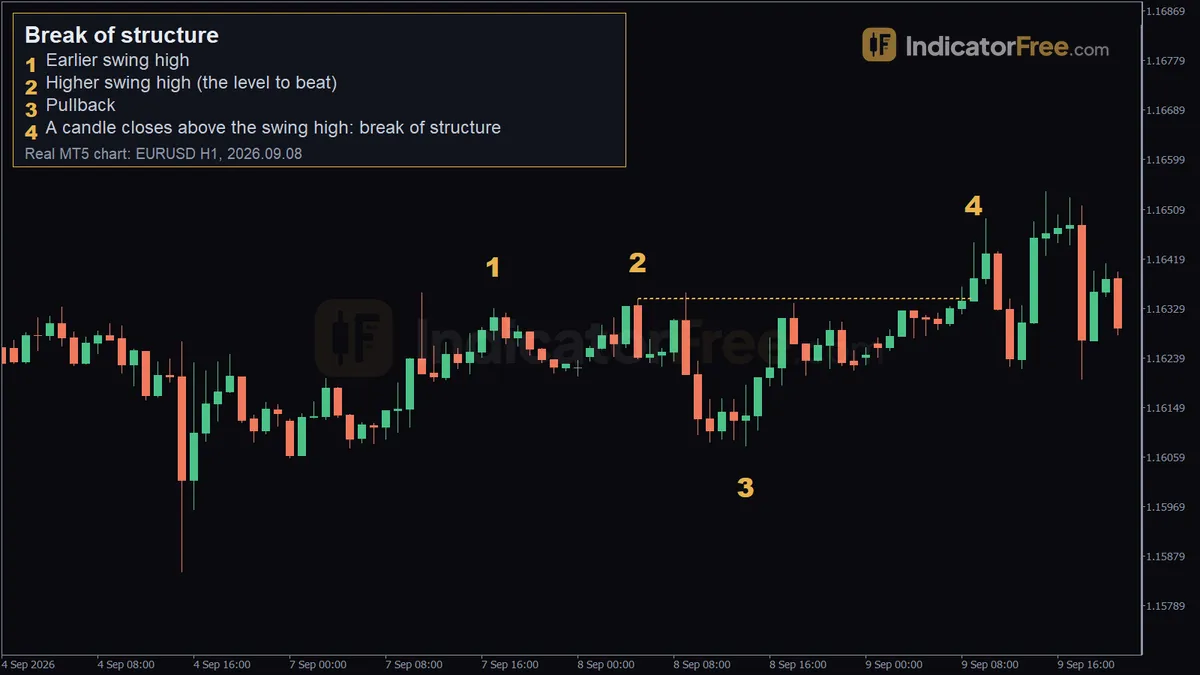
A break of structure tells you whether the trend you want to trade is still alive. Two mistakes cause many losing trades around it: buying a wick that only poked above a high, and trading against a trend that has just confirmed itself.
How to identify a break of structure: 6-step checklist
A swing high is a candle whose high is above the highs of the candles on both sides of it. A swing low is the mirror image. Market structure is simply the order of these points.
- Pick one timeframe and read the trend. Higher highs and higher lows mean up. Lower lows and lower highs mean down.
- Mark the most recent confirmed swing high in an uptrend, or the most recent swing low in a downtrend. This is the level to beat.
- Wait for a pullback that creates a new higher low (uptrend) or lower high (downtrend).
- Wait for a candle to close beyond the level from step 2. A wick through it does not count.
- Check the direction. The break must go the same way as the trend. A first break against the trend is a different signal (see below).
- Mark the pullback low (or high) from step 3. This is now the protected level: if price closes back through it, the move is in doubt.
What makes a break of structure weak or invalid
Wick only. If price spikes above the swing high but the candle closes below it, structure is not broken. Sellers pushed it back, and that is often a warning, not a signal.
The chart below shows the difference with made-up prices: the first candle pokes above the swing high and closes back under it, and only the later candle that closes above it counts.
Close, then straight back. A candle closes above the high, but the next one or two candles close back below it. Treat that as a failed break. Your rule before entry: if price closes back inside the old range within 2-3 candles, stand aside. Once a retest order has filled, a close slightly below the broken high is allowed; only a close below the protected low cancels the trade.
Breaking a minor swing. A tiny swing high made of two or three small candles is noise. On a 5-minute chart these form constantly. A break of one tells you little about the bigger trend.
No real pullback. If price never pulled back before the "break", there is no new higher low to protect. You have nowhere logical for a stop.
News spike. A break made by a single candle during a major release can reverse just as fast. Wait for the next candles to hold.
Reading the EURUSD 1-hour break of structure
The chart at the top of the page is a past example on the EURUSD 1-hour chart, not a prediction. Follow the markers in order.
- Marker 1, earlier swing high: on 2026.09.07 at 17:00, price topped at 1.16329.
- Marker 2, higher swing high: on 2026.09.08 at 05:00, price made a slightly higher top at 1.16346. A higher high means the trend was up. This became the level to beat.
- Marker 3, pullback: by 2026.09.08 at 14:00, price had dropped to 1.16080. That is about 26.6 pips below the high (1.16346 − 1.16080 = 0.00266). It held there and became the higher low to protect.
- Marker 4, break of structure: the candle on 2026.09.09 at 09:00 closed at 1.16383, above 1.16346.
Notice how small the break was. The close was only 3.7 pips above the old high (1.16383 − 1.16346 = 0.00037). A valid break does not need to be large. It needs to be a close, and it needs to hold. From this point, a close back below 1.16080 would undo the bullish structure.
What usually happens after a break of structure
Price tends to do one of three things next:
- Keeps going without looking back. You missed the entry, so wait for the next pullback.
- Retests the broken level. It dips back toward the old swing high, which now acts as support, and then turns up again. This is the common entry.
- Fails. It closes back below the broken high and then below the protected low. That second break against the trend is a change of character (CHoCH), the first sign that the trend may be turning.
Decision rule: hold the bullish idea while the protected low holds. If price closes below the protected low, close the trade and stop looking for buys.
Trading a bullish break of structure: retest entry, stop and target
The levels in this setup come from the EURUSD 1-hour chart at the top of the page, a past example. The account size, stop buffer and position size are an illustrative example.
Setup: buy the retest of the broken 1.16346 high
After the candle closed at 1.16383, above the 1.16346 swing high, the old high becomes the place to buy. You place a buy limit order at 1.16346 and wait for price to dip back to it.
- Entry: 1.16346, on the retest of the broken high.
- Stop loss: 30 pips below entry, a few pips under the 1.16080 pullback low (the protected level).
- Target: 60 pips above entry, twice the risk (2R).
The diagram below shows the sequence.
If price never comes back to 1.16346, the order stays unfilled and you lose nothing. That is better than chasing the breakout candle with a wider stop.
Working out the position size
In the same example, the account holds $9,000 and you risk 1% per trade. On EURUSD, a USD-quoted pair, one standard lot (100,000 units) is worth $10 per pip.
At 0.30 lots, hitting the stop costs $90. Hitting the target makes $180 before costs.
Bullish and bearish break of structure
In a bullish break of structure, a candle closes above the last swing high in an uptrend, as in the example above. In a bearish break of structure, a candle closes below the last swing low in a downtrend: you sell the retest from below, with the stop above the last lower high. Change of character has its own entry in this glossary.
When a break of structure works and when to skip it
It reads best in markets that trend cleanly. Typical examples are an active trading session in forex, or a strong directional day in crypto. The logic is the same on any market and any timeframe. Day traders often take the break on a 5- or 15-minute chart while following the 1-hour trend.
Skip it in tight sideways ranges, where every swing gets taken out both ways. Skip it in the minutes around major news, and in thin, quiet hours, where small wicks create fake swings.
| Pros | Cons | |
|---|---|---|
| Clarity | Clear rule: a close beyond a marked level | You must decide which swings count, and that is subjective |
| Risk | The protected low gives a logical stop | That stop can be far away after a deep pullback |
| Timing | A retest entry gives a defined price | Strong moves often leave without a retest |
| Conditions | Works on any market and timeframe | Gives many false signals in ranges |
Practical tips for trading breaks of structure
- Mark swings on the timeframe above your entry chart. Take only breaks that agree with that higher trend.
- Prefer the retest over the breakout candle. It usually gives a tighter stop and a better ratio of reward to risk.
- After two failed breaks in a row at the same area, treat the market as a range until it proves otherwise.
- Log each break you trade: timeframe, size of the close beyond the level, and whether it retested. Your own records will show which breaks are worth your money.
Quick BOS checklist before you enter
- Did the next one or two candles hold beyond the broken level?
- Is your stop beyond the protected level, and is the lot size worked out from that distance?
- Does the money lost at the stop match the risk you set per trade?
FAQ
Can an indicator mark breaks of structure for me?
Yes. Structure indicators find swing points with a lookback setting and draw a line when a candle closes beyond one. Check whether the lines appear only after the candle closes. Also check whether past lines move later, because that changes what you would have seen live.
How do I know which swing high counts as the last one?
It is the most recent swing high that price has clearly pulled back from, so that a new higher low formed after it. Ignore tiny swings inside the pullback itself. In the EURUSD example, 1.16346 counted because the pullback to 1.16080 came after it.