









Change of character
Also called CHoCH, CHOCH, Character change
A change of character (CHoCH) is the first candle close beyond the swing point that kept a trend alive, such as a close above the latest lower high in a downtrend. It is the earliest structural sign that the trend may be turning.
Treat a change of character as a warning first and a trade signal second. It tells you the side you have been trading may have lost control. That means you protect trades that follow the old trend and start planning trades the other way. On its own, it does not confirm that a new trend has started.
Change of character vs break of structure: same break, opposite meaning
A break of structure (BOS) is a close beyond a swing in the same direction as the trend, so it says the trend continues. A change of character is the first close against the trend. The mechanics are the same, but the meaning is the opposite.
The drawing below shows one downtrend. The two closes below earlier lows are breaks of structure. The first close above the latest lower high is the change of character.
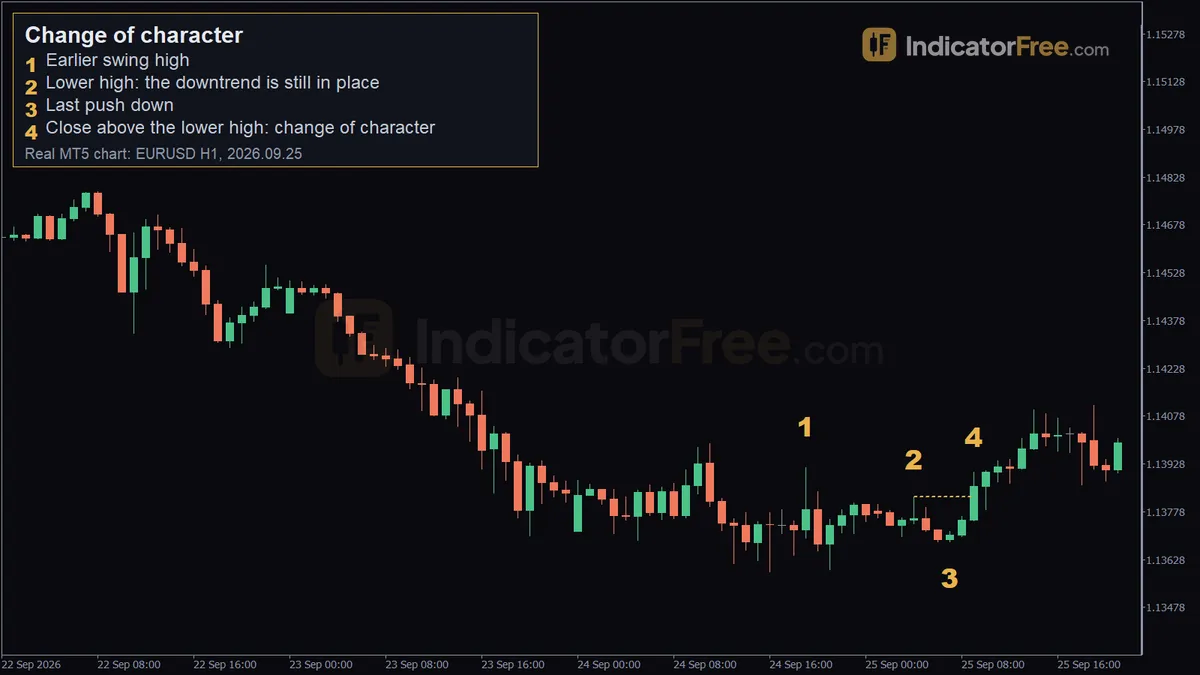
A bullish change of character ends a downtrend, as in the EURUSD example below. A bearish change of character is the mirror: in an uptrend, a candle closes below the latest higher low.
How to spot a change of character: 5-point checklist
- Name the trend first. You need at least two lower highs and lower lows (a downtrend) or two higher highs and higher lows (an uptrend). With no trend, there is no character to change.
- Mark the protected swing. In a downtrend, this is the latest lower high: the most recent swing high that sits below the one before it. In an uptrend, it is the latest higher low.
- Wait for the candle to close. Only a candle body closing beyond that swing counts. A wick that pokes through and then closes back inside does not count.
- Make sure it is the first break against the trend. After the new direction makes its own swings and breaks them, those later breaks are breaks of structure, not more changes of character.
- Read it on the timeframe you trade. A change of character on the 5-minute chart inside a daily downtrend is, at most, a pullback signal.
Reading the EURUSD 1-hour change of character, marker by marker
The chart at the top of the page is a past EURUSD 1-hour example, not a prediction.
- Marker 1, the earlier swing high: 24 September 2026, 19:00, at 1.13916.
- Marker 2, the lower high: 25 September, 04:00, at 1.13824. It sits below 1.13916, so the downtrend is still in place. This is the level to watch. The highs kept falling (1.13991, then 1.13916, then 1.13824) while the lows held near 1.1359. That is a weak downtrend, and one more reason to treat this change of character as marginal.
- Marker 3, the pullback low: 07:00, at 1.13684. Note that this is above the 1.13590 and 1.13595 lows of 24 September (16:00 and 21:00), so sellers failed to make a new low. This higher low was the first hint that the downtrend was weakening.
- Marker 4, the change of character: the 09:00 candle (the marker is drawn at 1.13901) closed at 1.13858, above the 1.13824 lower high.
The close went only 3.4 pips past the level (1.13858 − 1.13824 = 0.00034). Note what did not happen: price was still below 1.13916. The short-term structure flipped, but the earlier high stayed untouched overhead. That is the first place sellers may defend.
Strong, weak or skip: judging a change of character
| Verdict | What you see |
|---|---|
| Strong | A candle body closes beyond the protected swing, and the break candle is large and closes near its extreme. It counts for more after a long move into a higher-timeframe support or resistance level, or after price briefly dips below an obvious old low and snaps back. |
| Weak | Only a wick crosses the level. The swing it breaks is a small internal wiggle rather than the swing that produced the last low. The break candle is tiny and gets sold back at once. |
| Skip | Inside a sideways range, where swings break both ways all day. In the minutes around major news releases. When it fights a strong higher-timeframe trend and there is no higher-timeframe level nearby. |
A close back below the broken lower high is a warning. A new low below the last push down cancels it. When a close above the level is followed by a quick fall to a new low, traders call it a failed change of character, or a liquidity sweep after the fact: price ran the stops above the swing and the downtrend carried on.
The chart below shows a different trap in one downtrend: a wick through the lower high versus a close above it. The first poke above the lower high is only a wick. The real change of character comes later, when a candle body closes above the level.
Now run the three weak-row tests on the EURUSD 09:00 candle. It passes the first two: the body closed above 1.13824, and 1.13824 was the latest lower high under the 1.13916 swing high, not an internal wiggle. The pullback after it held at 1.13684, above the 1.13590–1.13595 lows, so sellers had already failed to make a new low before the break. It passes the third too: the 09:00 candle was the largest in nine hours and the next candle closed higher at 1.13902. The one weak point is distance: the close cleared the level by only 3.4 pips. Count it as valid but marginal, and do not trust it until price holds above 1.13824 on a retest.
Planning a trade from the EURUSD change of character
Buying the retest of the broken lower high
This plan uses the real chart levels. The account size, risk and lot size are an illustrative example: a $10,000 account, 1% risk, and a standard lot worth $10 per pip on EURUSD.
- Entry: a buy limit at 1.13824, the lower high that was broken.
- Stop loss: at 1.13684, the pullback low (Marker 3). If that higher low breaks, buyers have failed and the idea is wrong.
- First target: 1.13916, the earlier swing high.
The numbers above show the catch: the first target is closer than the stop. Use this rule: if the nearest opposing swing pays less than 1:1, either skip the trade or take it only if your plan is to hold beyond 1.13916. In that case, trail your stop under the first higher low.
In this past example, the trade filled and reached the first target. That is a past outcome, not a promise. The 10:00 candle dipped to 1.13784, which would have filled the buy limit at 1.13824, and then closed above the level at 1.13902. That is what "holds on a retest" means: the wick dips below the broken level, but the candle closes above it. The stop at 1.13684 was never touched, and the 11:00 candle's high of 1.13938 went past the 1.13916 first target.
Why buying the break candle was worse
Say you had bought the 09:00 close at 1.13858 instead. The stop at 1.13684 would be 17.4 pips away, while the earlier high would be only 5.8 pips away. Chasing the break candle makes the stop bigger and the target smaller: 17.4 pips of risk for 5.8 pips of reward.
FAQ
What if the break candle closes exactly on the lower high?
It does not count. A close on the level is not a close beyond it. Wait for a later candle to close past the swing before you call it a change of character.
Where do I put my stop after a bearish change of character?
Use the mirror of the EURUSD plan. Place it just above the last push up before the break, which is the high that failed to beat the uptrend's top. If price goes back above that high, sellers have failed and the idea is wrong.