









Weekly open
Also called Weekly opening price, Week open, Weekly open price, WO
The weekly open is the first traded price of a new trading week: the open of the week's first candle. Traders draw it as a horizontal line and use it as a bias filter and as a support or resistance level for the rest of that week.
The line is fixed the moment the week starts and never moves, so you can plan around it days ahead. It also tells you who is winning the week: above it, anyone who bought at the open is in profit; below it, they are losing. If you buy below the weekly open and aim above it, the Monday buyers who are still losing may sell to break even as price reaches the line, which can stall your trade right there.
How to mark the weekly open on your chart
- Find the first candle of the week on a 1-hour chart, or read the open of the current candle on a weekly chart.
- Draw a horizontal line at that exact open price and extend it to the right until the end of the week.
- Compare it with the last close of the previous Friday. If the two prices differ, mark Friday's close as a second line.
- Note which side of the line price is on now. That side is your working bias.
- Wait for price to return to the line. The middle of nowhere is not a setup.
- When a new week starts, remove the old line and repeat.
Forex weekly open time: the forex week starts when trading resumes in the Asia-Pacific region on Monday morning there, which is still Sunday evening in New York. Which candle counts as "first" on your chart depends on your broker's server clock and price feed. Your line can therefore sit slightly away from another trader's, so treat it as a thin zone, not a single price.
The weekend gap: when the weekly open is not Friday's close
A weekend gap is the space between Friday's last price and Monday's first price. News released while the market is closed cannot be traded, so price can restart at a different level. The drawing below shows the two prices and the gap between them.
Weekly opening gap trading means trading the move from the weekly open back towards Friday's close, called a gap fill. Gaps do not always fill, so use a rule instead of a hope:
- If the gap is smaller than your normal stop distance, ignore it and treat both prices as one zone.
- If it is larger, mark both lines and stay out of the space between them until a candle closes outside it.
Spreads are usually wider in the first minutes after the market reopens. Use the first candle to mark the level, not to trade it.
A valid weekly open reaction vs a broken level
A reaction is valid when price arrives from a distance, touches or slightly pierces the line, and the candle closes back on the side it came from. The next candle should then continue away from the line.
The level is weak when price has already crossed it cleanly twice in the same session; after the second clean cross, stop trading the line that day. Each crossing tends to use up orders resting there, so the first retest of the week tends to be the cleanest one.
The level is broken when a candle closes clearly beyond it and the following candle does not come back. From that point the bias has flipped, and the line is watched from the other side.
Common misread: a wick through the line is not a break. Judge by the close of the candle on the timeframe you trade. If you trade the 1-hour chart, a 5-minute close beyond the line means nothing yet.
The EURUSD 1-hour example: a test from above that bounced
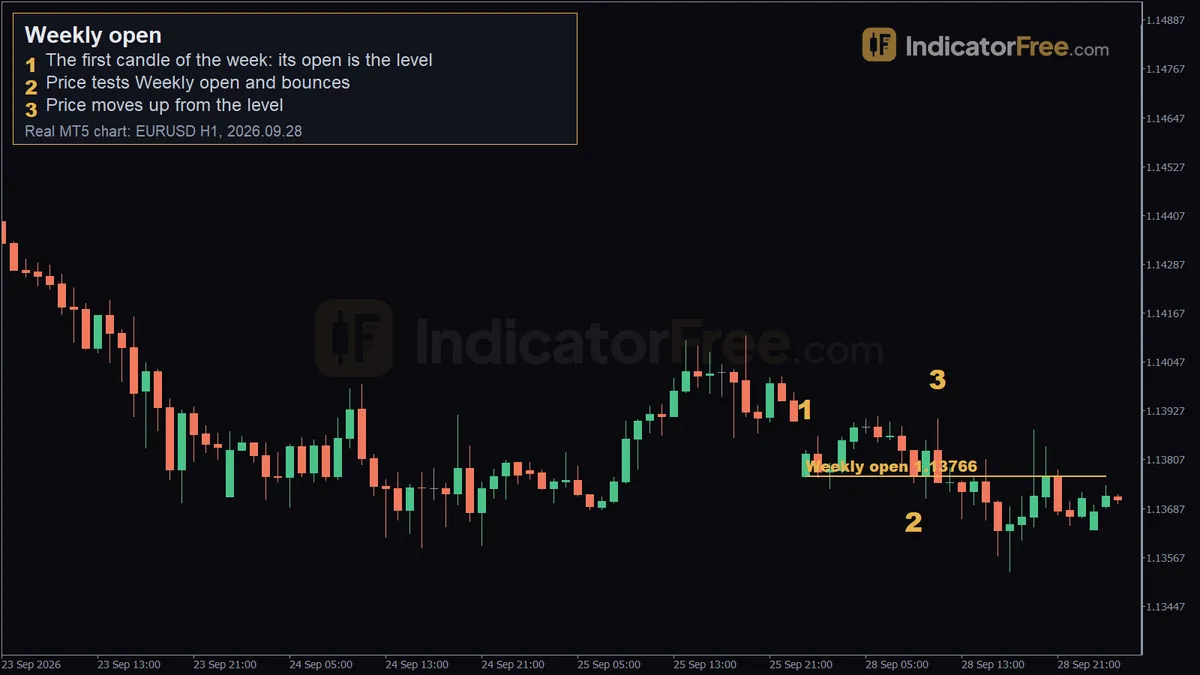
The chart at the top of the page is a past example on EURUSD, 1-hour chart, not a prediction. The weekly open on that chart was 1.13766.
- Marker 1 (28 September 2026, 00:00): the first candle of the week. The marker sits on the candle body at 1.13829; the line is drawn at the candle's open, 1.13766.
- Marker 2 (28 September 2026, 09:00, 1.13751): price comes back down to the weekly open from above, dips 1.5 pips below it and bounces.
- Marker 3 (28 September 2026, 11:00, 1.13907): price moves up and away from the level, about 14 pips above the line. Over the 10 candles after the test, price moved 16 pips up.
This is the valid reaction described above, seen from the long side. Price returned to the line from above, pierced it by only 1.5 pips, and then moved back up, away from the line.
Marker 2 is also the common misread in action. The dip below the line could look like a break, but the dip below the line did not hold. A trader who sold that dip would have been on the wrong side of the move that followed.
Two weekly open setups with entry, stop and target
The setups below are an illustrative example on a USD-quoted pair, with every distance measured in pips from the weekly open. They are not from the real chart.
Setup 1: bounce off the weekly open (long)
Price rallies from the open to a high 30 pips above it, then pulls back. One candle dips 3 pips below the line and closes back above it. The next candle closes higher, 10 pips above the line. The chart below shows the sequence.
- Entry: buy at the close of the candle that confirms the bounce, 10 pips above the weekly open.
- Stop loss: 5 pips below the weekly open, which is 2 pips below the test low. Risk is 15 pips.
- Target: 40 pips above the weekly open, which is 30 pips from the entry, twice the risk.
Before entering, check the nearest obstacle. Here it is the earlier high, 20 pips from the entry. Decision rule: if the nearest obstacle is closer than your stop distance, skip the trade. Here 20 pips is more than 15, so the trade is allowed. The earlier high still sits 10 pips short of the target, so expect a pause there; some traders take half off at that level.
Position size follows from the stop, not the other way round. With a $6,000 account, 1% risk and the standard $10 per pip on one standard lot:
Setup 2: break and retest (short)
A 1-hour candle closes 12 pips below the weekly open. Price then climbs back, reaches 2 pips above the line and is rejected, with a candle closing 8 pips below the line. The drawing below shows the sequence.
- Entry: sell at the close of the rejection candle, 8 pips below the weekly open.
- Stop loss: 7 pips above the weekly open, which is 5 pips above the retest high. Risk is 15 pips.
- Target: 30 pips below the entry, twice the risk.
If price closes back above the weekly open before the rejection candle forms, there is no trade. The break has failed.
When the weekly open helps and when to leave it alone
It tends to be most useful early in the week, on the first return to the line, and when a higher-timeframe trend points the same way. It carries more weight when another level sits at the same price, such as the previous day's high or low.
Leave it alone when price has been chopping back and forth across the line, just before major scheduled news, and late on Friday when a fresh level is hours away.
| Pros | Cons |
|---|---|
| One fixed price, no settings to tune | Differs slightly between brokers |
| Known for the whole week in advance | Only one level per week, so few setups |
| Gives a simple long or short bias | Little use in a sideways week |
| Easy to combine with other levels | Weekend gaps can blur where it is |
Practical tips for trading the weekly open
- Draw the line before you look at any setup. Drawing it after a move makes every bounce look obvious.
Quick checklist before you click
- Is the line drawn at the first candle's open, and is any gap marked?
- Is this the first or second test this week, not the fifth?
- Did a candle close back on the right side of the line?
- Is the nearest obstacle further away than your stop?
FAQ
Does the weekly open work on stocks and indices?
Yes. Stock markets trade five days a week in daily sessions, so the weekly open is Monday's first price. Gaps tend to matter more there, because the market also closes every night.
Can I use the weekly open for day trading, or only for weekly trades?
Both. A day trader uses it as one level and one bias for intraday entries. A trader holding for days uses it to decide which direction to hold. Neither style is profitable by itself; results depend on risk control.
Do I need an indicator to plot the weekly open?
No. A horizontal line at the open of the weekly candle is enough on any charting platform. An indicator only saves you from redrawing it every Monday.