Technical analysis
Also called TA, Chart analysis, Technical trading
Technical analysis is a way of making trading decisions from past price movement on a chart. You read trends, support and resistance levels, candle patterns and indicators to judge where price may go next and at what price your idea is wrong.
It does not predict the future. It turns a chart into a plan with a fixed loss, so one bad trade cannot quietly grow into a big one.
What technical analysis reads on a price chart
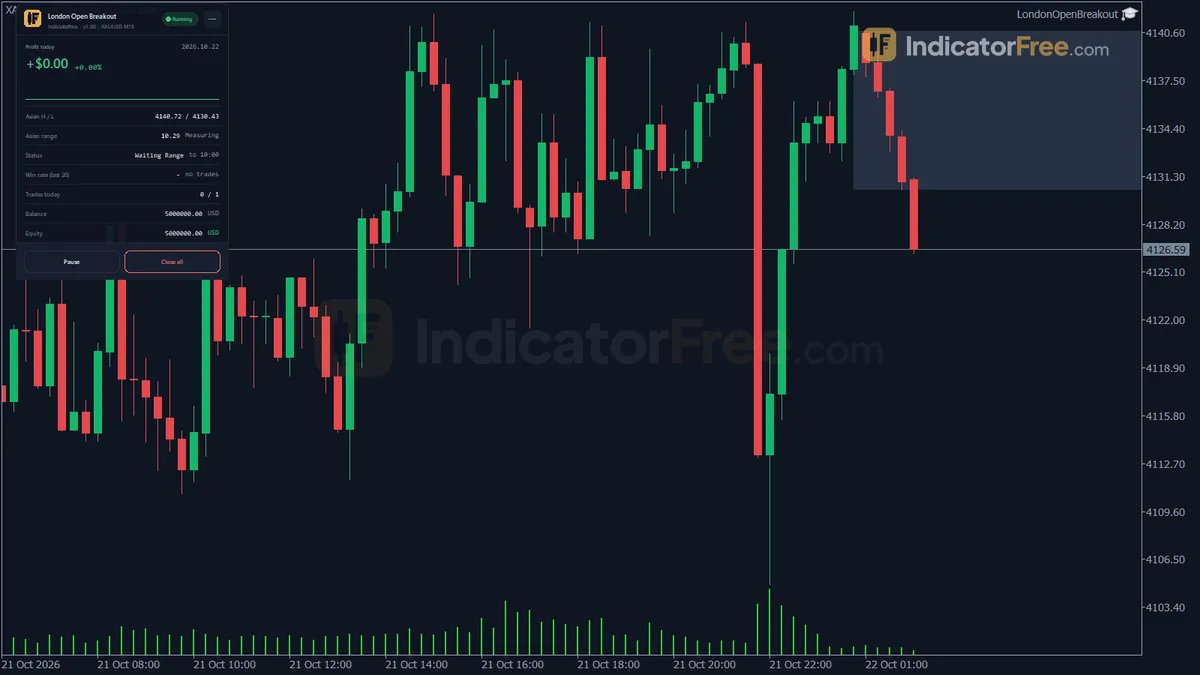
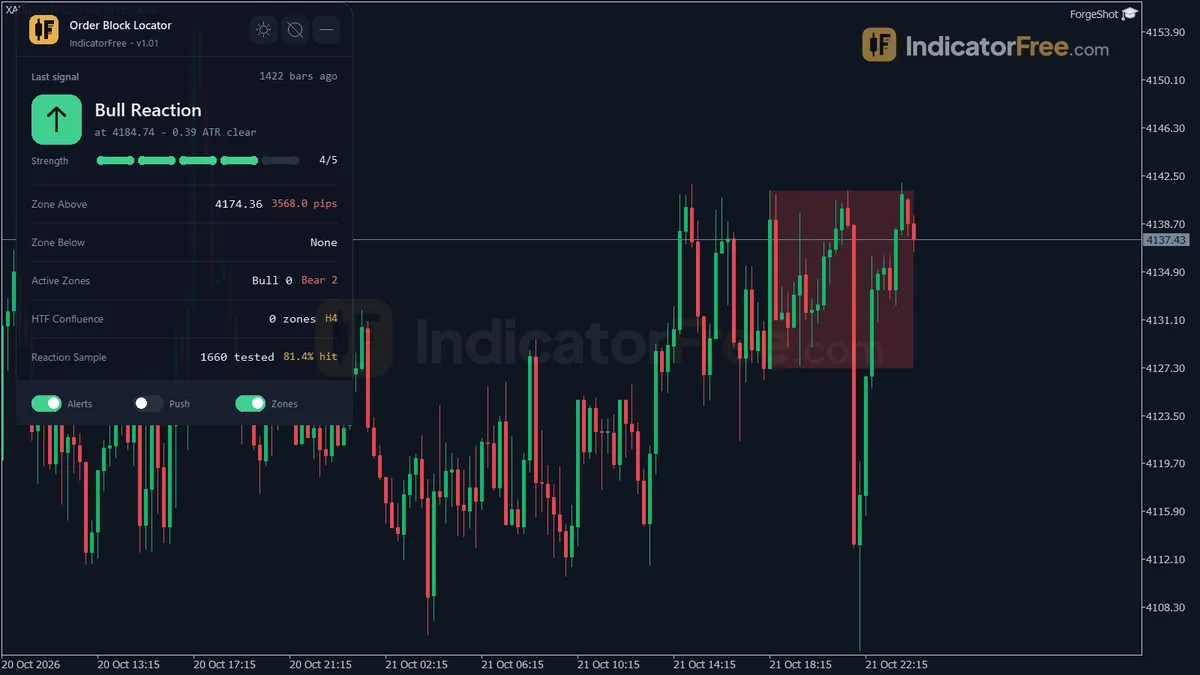
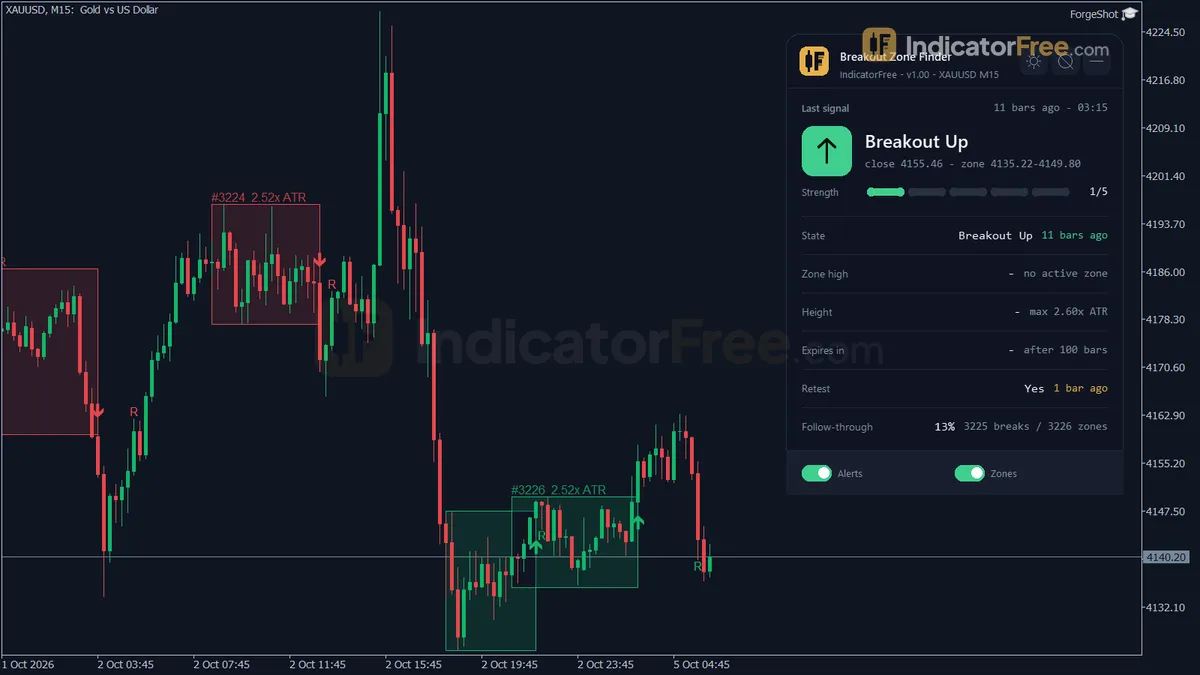
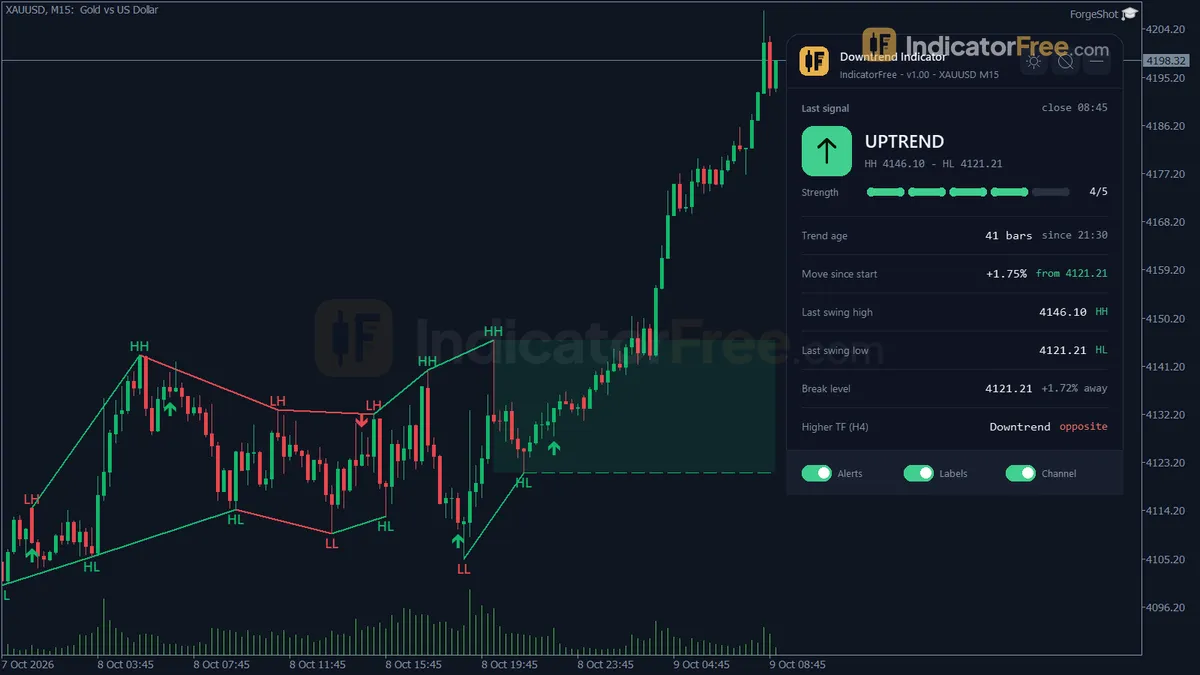
Technical analysis rests on one idea. Price already reflects what traders know and fear, and crowds tend to react to similar situations in similar ways. Because of that, some price behaviour repeats often enough to plan around. A candle is one bar on a price chart for one period, such as one hour or one day. Its thick body runs from the open to the close, and thin lines called wicks reach up to the high and down to the low. A bullish candle closes above where it opened, and a bearish candle closes below it. The candle charts below draw each one this way.
| Tool | What it tells you | Common misread |
|---|---|---|
| Trend (higher highs and higher lows, or lower highs and lower lows) | Which side has control | Calling a trend from two candles |
| Support and resistance (prices where buying or selling showed up before) | Where price may stall or turn | Treating a level as one exact price instead of a zone |
| Candle patterns | How buyers and sellers fought within a period | Acting before the candle has closed |
| Indicators (maths on past prices, such as moving averages or RSI) | Whether a move is speeding up or slowing down (RSI), and the average price over a period (moving average) | Buying just because RSI is below 30 in a strong downtrend |
The last row of the table is the misread that costs beginners most. In the chart below, RSI drops under 30 early in the fall, and a trader who buys there keeps losing as price slides lower.
The trend row needs the same patience. The next chart marks each higher high and higher low, so you can see that an uptrend is a sequence of swings, not one strong candle.
Turning a chart reading into a trade
Here is an illustrative example. EUR/USD falls from a swing high at 1.1070 (the peak of a recent rise, before price turned down) to a support zone that runs from 1.0998 to 1.1008 and tests it twice, with a final dip to 1.0999. The bounce between the two tests is weak and stalls at 1.1016. Then a bullish candle closes at 1.1020. The chart below marks the zone, the entry, the stop and the target.
Distances are measured in pips. On EUR/USD, one pip is the fourth decimal place (0.0001), so a move from 1.1020 to 1.1021 is one pip. The chart gives you three prices:
- Entry: 1.1020, the close of the bullish candle.
- Stop loss: 1.0995, just below the zone. This is your invalidation price, the price at which your trade idea is proven wrong: if price trades there, support has failed. That is 25 pips of risk. The zone is 10 pips tall (1.0998 to 1.1008), so the stop sits 3 pips below its floor, a buffer of about a quarter of the zone's height. The second test only reached 1.0999, so that buffer clears it. A buffer this small suits a calm market only. On a small zone, or when price is swinging widely, widen it so the stop does not sit inside normal price noise.
- Target: 1.1070, the last swing high before the drop. This is the next resistance above the entry, because the bounce between the tests stalled at 1.1016, below 1.1020. That is 50 pips of reward.
Now size the trade. Say the account holds $10,000 and you risk 1%. On EUR/USD in a USD account, one standard lot (100,000 units) moves $10 per pip.
The chart decides where the stop goes. The stop distance then decides the lot size. Many traders get this backwards. They choose a lot size first and squeeze the stop to fit, so the stop lands inside normal price noise. Size first from the stop, then type the stop and target into the order window, or place a pending order (an order that waits and triggers only when price reaches the level you set) at the level.
Technical vs fundamental analysis: what each one reads
| Technical analysis | Fundamental analysis | |
|---|---|---|
| What it studies | Price, trends, levels and indicators on a chart | Interest rates, inflation, growth and other economic data behind a currency |
| The question it answers | Where do I enter, and at what price am I wrong? | Which currency should be stronger over time, and why? |
| Typical holding time | Anything from minutes to months, set by the chart timeframe: technical analysis is used on weekly and monthly charts too | Weeks to months or longer |
Decision rule: if you plan to hold a trade for minutes, hours, days or a few weeks, let the chart set your entry, stop and target. If you plan to hold for months, pick the direction from fundamentals and use the chart only to time the entry and place the stop. You can read weekly and monthly charts with technical analysis, but the longer you hold, the more the economic picture matters next to the chart.
Checks before you trade a chart signal
- If you can't name your stop price from the chart, skip the trade.
- Check one timeframe higher. A buy signal on the 15-minute chart against a clear 1-hour downtrend is weaker. If the higher timeframe trends against your signal, skip it, or halve your risk (0.5% instead of 1%).
- Wait for the close. Candle patterns and many indicator signals can change until the bar closes.
- Put stops beyond the zone, not on its edge. Price often pokes through a level before it turns. A buffer of about a quarter of the zone's height is a starting point for a calm market. Widen it when price is volatile or the zone is small, because a quarter of a small zone can sit inside normal swings.
- Compare reward to risk. If the distance to the next resistance is less than your stop distance (reward below 1:1), skip the trade. In the example, the next resistance is the 1.1070 swing high, so 50 pips of reward against 25 pips of risk is 2:1.
- Check the economic calendar. A scheduled news release can break any level and widen the spread (the gap between the buy price and the sell price) for a while.
- Practise on a demo account first. Log 20 or more setups to see whether you apply your rules the same way each time.
FAQ
Does technical analysis actually work?
It works as a way to plan and cap risk, not as a forecast. Whether your rules make money is something only your own results can show. Write the rules down, apply them in your demo log, and compare total gains to total losses. If the total is negative, change the rules before you risk real money.
How many indicators should I put on my chart?
One or two that measure different things. If two indicators always signal on the same candle, remove one. It only repeats the other.
Which timeframe should a beginner start with?
Start with the 4-hour or daily chart. Move down one timeframe only after you have followed your rules on the higher one for a full logged sample, as in the demo check above.
Why does the same setup work one week and fail the next?
Each setup is a probability, not a certainty. Judge your method over a large sample of trades, never on one result.