









Oscillators & momentum
- Indicators
- 1
- Expert Advisors
- 0
- Downloads
- 2
1 tool
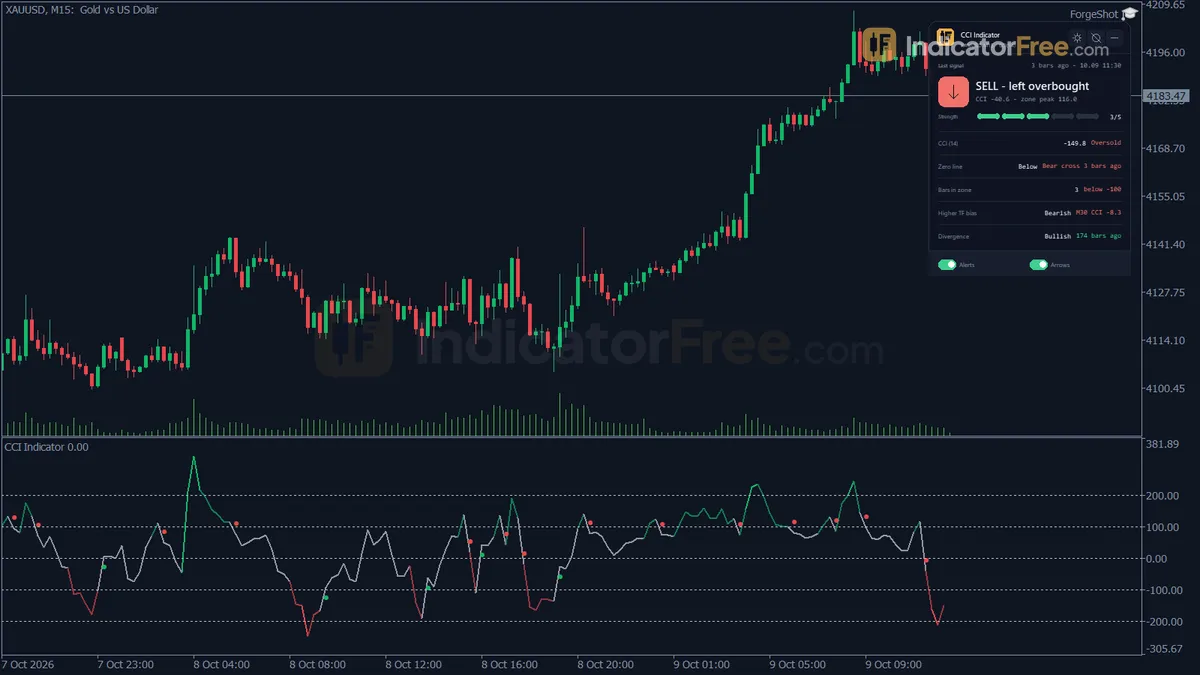
Oscillators measure momentum: how fast price is moving and whether that speed is growing or fading. They sit in a separate window below the chart and move between fixed levels or around a zero line. Tools like RSI, MACD, stochastic, CCI and the Awesome Oscillator belong here. The problem they solve is timing. They help you see when a move is stretched, slowing down or gaining strength.
RSI, stochastic, MACD and CCI: scale and speed compared
Most oscillators use the same raw data, so they often agree. The differences are in scale and speed.
| Oscillator | Range | What it is good at |
|---|---|---|
| RSI | 0 to 100 | Strength of recent gains vs losses; divergence |
| Stochastic | 0 to 100 | Where the close sits within the recent range; fast turns |
| MACD | Around zero | Gap between two averages; momentum shifts and crosses |
| CCI | Unbounded, often ±100 | How far price is from its average |
| Awesome Oscillator | Around zero | Simple momentum histogram; zero-line crosses |
| Williams %R | 0 to -100 | Similar to stochastic, inverted scale |
Pick one bounded oscillator (RSI or stochastic) and, if you want, one zero-line oscillator (MACD or AO). Two bounded oscillators on the same chart usually repeat each other.
Overbought does not mean sell
This is the most common mistake with oscillators. An RSI reading above 70 is called overbought. Many new traders sell as soon as they see it. In a strong uptrend, RSI can stay above 70 for days while price keeps climbing. The same is true for oversold readings in a downtrend.
A better reading: an extreme value means the move is strong, not that it is over. Use these if/then rules instead:
- If the trend is up, use oversold readings to find buy pullbacks. Ignore overbought.
- If the trend is down, use overbought readings to find sell rallies. Ignore oversold.
- If there is no trend, both extremes can work as fade signals near range edges.
Many traders also shift the RSI bands in a trend. In an uptrend, RSI often bottoms around 40 on dips. A drop well below 40, toward 30, can be the first sign the trend is weakening.
Divergence is a warning: three checks before acting on it
Divergence is when price and the oscillator disagree. Price makes a higher high, but RSI makes a lower high. The move is still going, but with less force behind it.
Divergence is a warning, not a signal. It can repeat two or three times before price turns, and each time a trader who sold too early takes a loss. Use this checklist before acting on it:
- Is the divergence at a level that matters, such as resistance or a supply zone?
- Is it visible on the timeframe you trade, not just on M1?
- Has price confirmed it with a break of structure the other way?
Without item 3, you are guessing the top.
An RSI pullback entry on EURUSD H1
Example: EURUSD on H1. A 50-period average is rising and price is above it.
- Price pulls back from 1.0900 to 1.0860 over six hours.
- RSI(14) falls from 68 to 38, then turns up and closes back above 40.
- A bullish candle closes at 1.0866, near the moving average.
- You buy at 1.0866 with a stop at 1.0846, 14 pips under the 1.0860 pullback low to leave room for noise. That is 20 pips of risk. Target is the prior high at 1.0900, 34 pips away.
The RSI did not pick the direction. The trend did. The RSI only told you the pullback had probably finished. If RSI had kept falling to 25, the dip would be turning into something larger, and you would wait.
Tools in this group include the Awesome Oscillator and the CCI indicator.
Oscillator periods, and their place as the timing layer
Shorter periods react faster but give more false signals. Longer periods are smoother but later.
- RSI 14 is a reasonable default. Try 7 to 9 for scalping, 21 for swing trades.
- Stochastic 14,3,3 is common. A faster 5,3,3 fits short-term range trading.
- MACD 12,26,9 is standard. Watch the signal line cross and the histogram slope, not only the cross itself.
In MetaTrader 5, test each change in the Strategy Tester on visual mode and count how many signals you would have taken in a month. Fewer, cleaner signals are usually easier to trade.
Oscillators work well as the timing layer. Let a trend tool set direction and a level tool set location. Then the oscillator tells you whether momentum agrees right now. A stochastic RSI is even faster, so use it only with a strong filter in place.
Log two weeks of RSI extremes with and against the trend
Read the trend topic hub, since most oscillator mistakes come from ignoring the trend. Then add RSI and a 50-period average to a demo chart. For two weeks, log every overbought and oversold reading and note what price did next with and against the trend.