









Oversold
Also called Oversold condition, Oversold zone, Oversold territory, Oversold level
Oversold means price has fallen so far and so fast that a momentum oscillator, most often the RSI, reads below its lower line (usually 30). It shows that selling is stretched. It does not promise a bounce.
A common way to lose money with this idea is to buy as soon as a market turns oversold. The reading tells you sellers have been in control lately. It does not tell you they are finished. Treat it as a reason to start watching for a turn, never as the turn itself.
How to spot a tradeable oversold reading
- Choose one oscillator and one threshold, and don't change them. The usual choice is RSI with a 14-period setting and a lower line at 30.
- Wait for the candle to close. RSI can dip below 30 mid-candle and finish back above it. Only the closing value counts.
- Look at the next timeframe up. An oversold reading while that higher timeframe is rising carries more weight than one while it is falling.
- Mark the low of the oversold move. Your stop loss goes below it.
- Wait for the hook, which is the oscillator closing back above 30. That close is your trigger.
What makes an oversold reading valid, weak or broken
A valid reading forms at a price level that already matters: the floor of a range, an old support, or a pullback inside an uptrend. The oscillator stays under 30 only briefly and then climbs back. While that happens, price stops making new lows.
The chart below shows the shape you want: a short stay under 30, then a clean close back above it.
A weak reading forms in open space, in the middle of a sharp, news-driven drop. RSI can stay pinned near 20 for many candles while price keeps falling. Each new low with RSI stuck down there means sellers are still pushing. That shows a strong trend, not tired sellers.
A broken reading is one that hooked back above 30 and triggered your trade, and then price closed below the low you marked. At that point the setup is over. Don't wait for a second dip so you can add to a losing position.
Reading the EURUSD oversold example, marker by marker
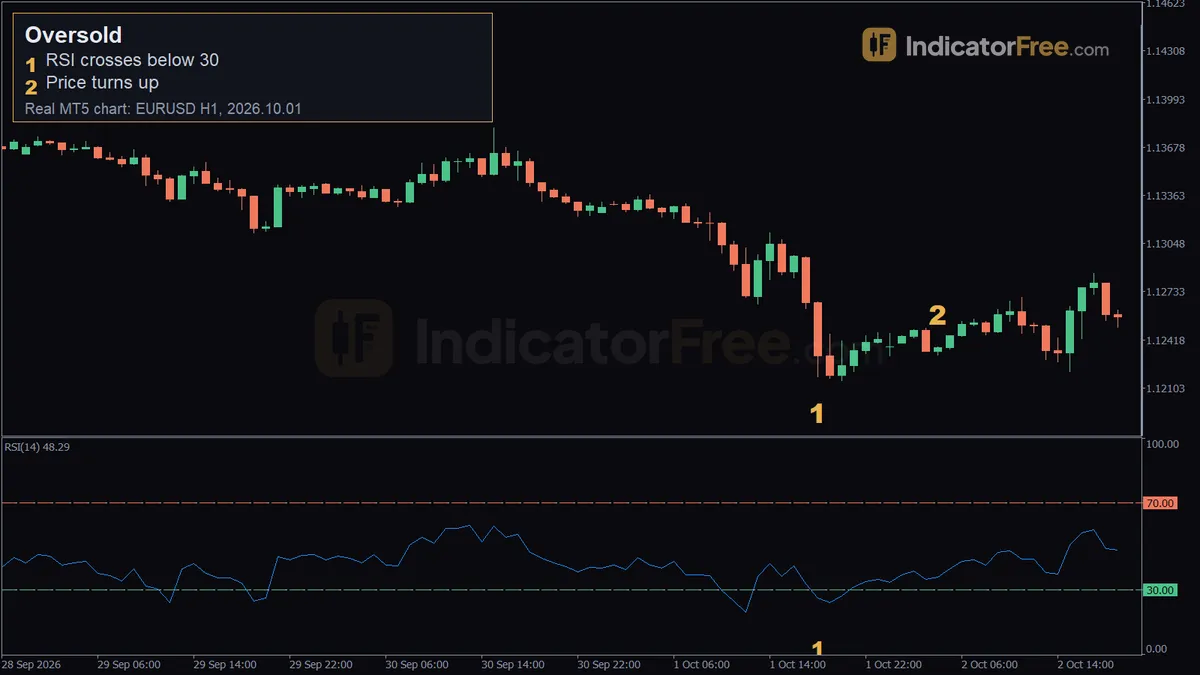
The chart at the top of the page shows EURUSD on the 1-hour timeframe. It is a past example, not a prediction.
- Marker 1, RSI crosses below 30. On 1 October 2026 at 18:00, RSI(14) fell to 26.1 with price at 1.12177. This is the oversold reading.
- Marker 2, price turns up. On 2 October 2026 at 04:00, ten candles later, the turn is marked at 1.12372.
Over the 15 candles after the cross, price rose 54 pips. Price was already 19.5 pips above the cross price when the turn was marked (1.12372 − 1.12177 = 0.00195). A buy at the cross would have sat through the dip first, with no way to know it would turn.
How often markets actually turn oversold
The IndicatorFree Lab counted RSI readings on 12 months of broker demo data, from 2 October 2025 to 2 October 2026. These are past data, not a forecast.
On EURUSD 1-hour, RSI(14) crossed below 30 about 7.2 times per month, a little under twice a week. RSI(7) did it 25 times per month and RSI(21) 3.6 times. On EURUSD 4-hour, RSI(14) crossed below 30 only 2.4 times per month. The chart below shows the share of candles that closed below 30 for each setting.
Here is a decision rule you can use. If your oscillator reads oversold on more than about one candle in ten, it is too sensitive to filter anything. Lengthen the period or move the line down to 20.
Oversold and overbought do not show up in equal amounts either. On XAUUSD 1-hour, RSI(14) spent 8.3% of candles above 70 and only 5.2% below 30 over the same period. Count the readings on your own market before you assume they balance out.
Two oversold setups with entry, stop and target
Both setups use one illustrative example, measured in pips from your entry rather than in prices, so you can apply it to any EURUSD chart and redo the maths yourself.
Setup 1: buying the floor of a range after the RSI hook
Price has moved sideways inside a clear range for two weeks. It drops to the floor of the range and RSI closes below 30. Two candles later, RSI closes back above 30.
- Entry: at the close of the hook candle.
- Stop loss: just under the oversold low, 25 pips below your entry.
- Target: just below the top of the range, 50 pips above your entry. That is twice the risk.
Setup 2: buying a pullback inside an uptrend
The 4-hour chart keeps making higher highs. On the 1-hour chart, price pulls back to an old resistance that now acts as support. RSI dips below 30 and then hooks back up.
- Entry: at the close of the candle where RSI closes back above 30.
- Stop loss: below the pullback low. That is 20 pips of risk.
- Target: the prior swing high, 60 pips above your entry.
In both cases, size the trade from the stop distance, not from how oversold the market looks. Here is Setup 1 on a $5,000 account risking 1%, using the standard $10 per pip for one standard lot on EURUSD:
When oversold signals work and when to stay out
Oversold readings tend to be more useful in sideways ranges and in pullbacks within a trend that is still intact. In both cases, buyers have a clear reason to show up at that level.
Stay out when a high-impact news release is driving the drop, when the higher timeframe is falling hard, or when RSI has stayed below 30 for many candles in a row. Also skip oversold readings on a very short timeframe that go against the daily trend.
| Pros | Cons |
|---|---|
| Clear and objective: the line is either crossed or it isn't | Can stay oversold for a long time in strong downtrends |
| Works the same way on any market and timeframe | Short periods produce many low-quality readings |
| Gives a natural place for the stop (under the low) | Waiting for the hook means a later entry |
| Pairs well with support levels | Says nothing about how far a bounce will go |
Bullish and bearish sides of an oversold reading
The stronger bullish version comes when price makes a lower low while RSI makes a higher low. That is bullish divergence, which has its own entry. The mirror reading at the top of the scale is overbought, also covered in its own entry.
Practical tips for trading oversold markets
- Don't switch RSI periods after one losing trade. Judge a setting over months of readings.
- Count a month of past oversold readings on your own market and timeframe. That number tells you how rare a real signal is.
Quick checklist
- Higher timeframe not falling hard?
- RSI closed below 30, then closed back above it?
- Price sitting at a level that matters?
- Stop under the low, trade size worked out from the stop?
FAQ
Should I use 30 or 20 as the oversold line?
Use 30 on longer periods such as RSI(14) or RSI(21). If you move the line to 20 on RSI(14), expect far fewer readings than the 7.2 per month counted at 30 on EURUSD 1-hour, with long gaps between them.
What happens when a stock is oversold?
Nothing happens automatically. The same RSI line means the same thing on stocks, forex or gold. There is nothing stock-specific about an oversold reading.
Should I close my short trade when the market turns oversold?
Not just because of the reading. Many traders take partial profit or tighten their stop instead, and close the rest only when RSI hooks back above 30 or price breaks a recent high.