RSI 14
Also called RSI(14), 14-period RSI, Relative Strength Index 14, RSI 14 close
RSI 14 is the Relative Strength Index calculated over the last 14 candles. It compares average gains with average losses and plots the result as one line from 0 to 100, with 70 and 30 as the usual overbought and oversold marks.
The 14 counts candles, not days. On a 1-hour chart it looks back about 14 hours; on a daily chart, 14 trading days. The costly misread is selling the moment the line passes 70, because a strong trend can hold it there for many candles.
How RSI 14 is calculated and what the line shows
RS  = average gain of the last 14 candles ÷ average loss of the last 14 candles
RSI = 100 − 100 ÷ (1 + RS)
A gain is a candle that closed above the previous close. A loss is one that closed below it. Both averages are smoothed, so each new candle nudges the line instead of jerking it, and older candles still count a little.
The line does not show how far price moved. It shows how one-sided the recent closes were. The calculation below is an illustrative example with an average gain of 9 pips and an average loss of 3 pips.
Gains three times the size of losses give 75. Equal gains and losses give 50.
When a label reads "RSI 14 close", the last word means the indicator uses closing prices. In MT5 the default RSI is period 14, applied to Close.
Reading RSI 14 on the chart: 70, 30 and 50
- Above 70 (overbought): buyers dominated the last 14 candles.
- Below 30 (oversold): sellers dominated the last 14 candles.
- The 50 line: above it, recent gains outweigh losses. Below it, losses lead. Many traders use it as a simple trend filter.
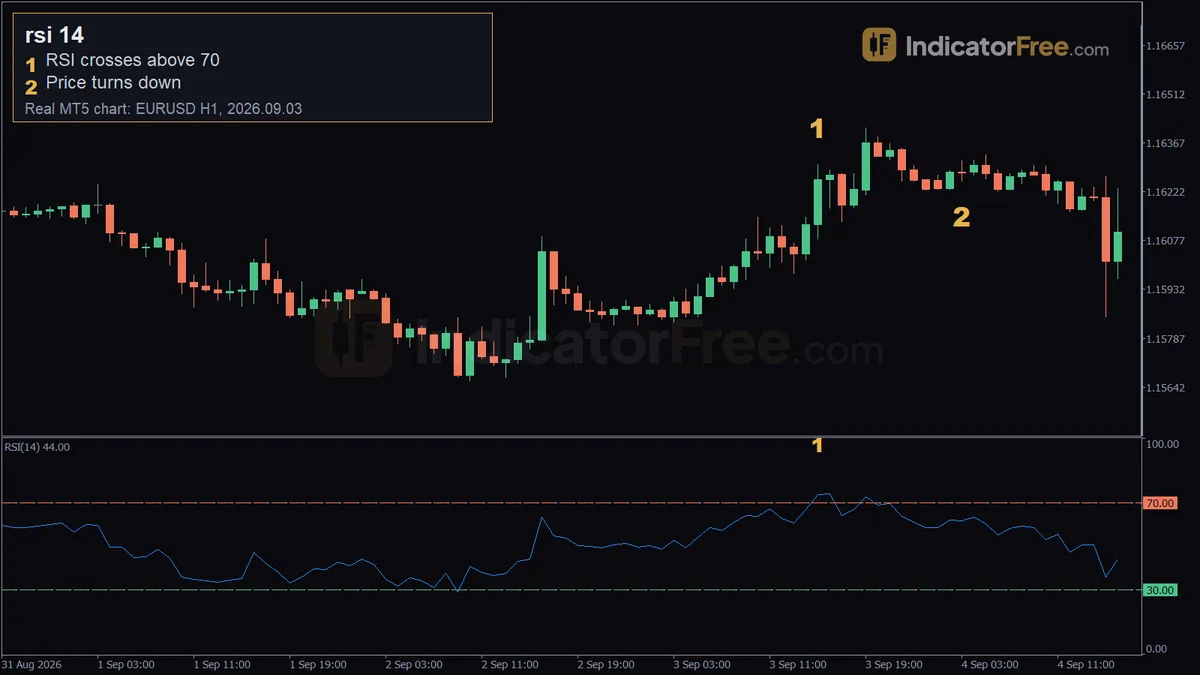
You can spot the trap when the line stays above 70 while price keeps printing higher highs. The chart below shows both halves: price making higher highs in the top panel while the line holds above 70 for several candles before it closes back under.
When RSI 14 helps and when to leave it alone
It works well when:
- Price is ranging between clear support and resistance.
- A trend pulls back and the line dips toward 50 before turning with the trend. In an uptrend, buy only when the line dips toward 50 and turns back up.
Avoid it when:
- Price is trending hard and you want to trade against it.
- A major news release is minutes away. One candle can push the line to an extreme that says nothing about the next move.
- You trade very short timeframes in quiet hours, where small candles flip the line back and forth.
Pros and cons of the 14 setting
| Pros | Cons |
|---|---|
| One line on a fixed 0 to 100 scale, easy to read on a phone | Lags price, because it averages 14 candles |
| Same levels on every market and timeframe | Uses closing prices only, so it ignores volume and candle range |
| The default period on most platforms | Gives no stop or target by itself |
| 5.8 crosses above 70 per month on EURUSD 1-hour, between period 7 and period 21 (Lab count, past data) | Too slow for some scalpers, too busy for some swing traders |
Quick checklist: the RSI 14 decision rule in order
- RSI 14 crosses above 70: do nothing yet. Treat it as an alert.
- Wait for the line to close back below 70.
- Act only if a candle also closes below the low of the previous candle.
Mirror the three steps at 30 for buys, using the high of the previous candle.
A real RSI 14 overbought setup
EURUSD 1-hour: alert at 70, wait, then the trigger
The chart at the top of this page is a past example, not a prediction. Here is the checklist above applied to it step by step.
- Alert (marker 1): on 2026.09.03 at 15:00, RSI 14 rose above 70, to 73.7. That candle's high was 1.16302 and it closed at 1.16258. No trade yet.
- Wait: price did not turn. At 19:00 it climbed to 1.16411, about 11 pips above the alert candle's high. A sell at the 1.16258 close would already have been about 15 pips under water.
- Not a trigger (marker 2): marker 2 shows the first dip, but by the rule it is not a sell. The 2026.09.04 03:00 candle opened at 1.1628, dipped to 1.16253 and closed at 1.16279. The next candle made a higher high at 1.16315. Nothing broke, and you cannot fill a sell at a candle's low.
- Trigger: the 06:00 candle closed at 1.16229, under the 05:00 low of 1.16261. Rule 2 needs the line back under 70, and the RSI values after 15:00 are not in our data, so we cannot say whether the earlier breaks at 22:00 and 00:00 were valid. This example uses 06:00, the break after the marker 2 dip; check the RSI on your own chart. Entry: 1.16229.
- Stop loss: just above 1.16411, the highest high since the alert. That is about 18 pips above the entry.
- Exit: a time exit. This example closes the trade one day after the alert, at the close of the 2026.09.04 15:00 candle. It fell to 1.15851 and closed at 1.16016, about 21 pips below the entry. Against the 18-pip risk, that is a reward of about 1.2 times the risk. That candle's wide 1.15851 low shows how a fixed exit works both ways: here it left about 16 pips behind, and on another day the same rule could close the trade before a bounce takes the gain back.
The alert came 24 candles before the 15:00 drop to 1.15851. Selling at the cross would have meant sitting through the push to 1.16411 first.
Choosing the period: 14 or something else
| Trading style | Chart | Period to start with | Trade-off |
|---|---|---|---|
| Scalping | 5-minute, 15-minute | 7 to 14 | More signals, more false ones |
| Day trading | 1-hour | 14 | Middle ground |
| Swing trading | 4-hour, daily | 14 to 21 | Fewer signals, longer waits |
If 14 gives you too many alerts on gold (see the Lab table below), try 21 before you move the levels.
What the Lab measured
The IndicatorFree Lab counted how often the line crossed the two levels on broker demo data. This is past data, not a forecast.
On EURUSD 1-hour, period 14 gave 5.8 crosses above 70 per month against 18 for period 7 and 2.6 for period 21. So 7 alerts roughly three times as often and 21 less than half as often.
The table shows RSI(14) only. All four samples cover 2025-10-30 to 2026-10-30: EURUSD 6222 1-hour and 1556 4-hour candles, XAUUSD 5916 1-hour and 1548 4-hour candles.
| Market | Chart | Crosses above 70 per month | Crosses below 30 per month | % of candles above 70 | % of candles below 30 |
|---|---|---|---|---|---|
| EURUSD | 1-hour | 5.8 | 7.3 | 4.5% | 4.7% |
| EURUSD | 4-hour | 1.5 | 2.3 | 4.3% | 6% |
| XAUUSD | 1-hour | 8.5 | 7.5 | 7.2% | 5.1% |
| XAUUSD | 4-hour | 2.5 | 1.8 | 7.4% | 5.5% |
In these samples, gold sat above 70 more than below 30. EURUSD 1-hour was close to even, while EURUSD 4-hour leaned below 30. A one-sided market makes one of the two levels a weaker warning.
Practical tips for trading with RSI 14
- Read the line only on closed candles. The value of a forming candle changes until it closes.
- Check the higher timeframe first. Take 1-hour oversold signals only when the 4-hour line is above 50, and the reverse for sells.
- Size the trade from your stop distance, never from how extreme the reading is.
- Log at least 20 alerts on one pair before you change the period.
- Note which level fails more often on your pair. That tells you which side the market is leaning.
FAQ
Why does my RSI 14 value differ slightly between two charts of the same pair?
The smoothed averages depend on how much price history is loaded and on each broker's price feed. Two charts with different history or slightly different closes give slightly different readings. The gap shrinks as more candles load.
How many candles does RSI 14 need before I can trust the reading?
Many more than 14. The first values after the start of the data are rough, because the smoothing has not settled. Scroll back to load plenty of history before you rely on the line.
Does RSI 14 work differently on stocks than on forex?
The formula is identical. The difference is the market: stocks close overnight and can gap at the open, which moves the line in one jump. Forex can also gap, mostly over the weekend.