









Overbought
Also called Overbought zone, Overbought condition, Overbought level, OB
Overbought means a momentum oscillator, usually the RSI, has moved above a high threshold such as 70, showing a price move is stretched and may pause or turn down.
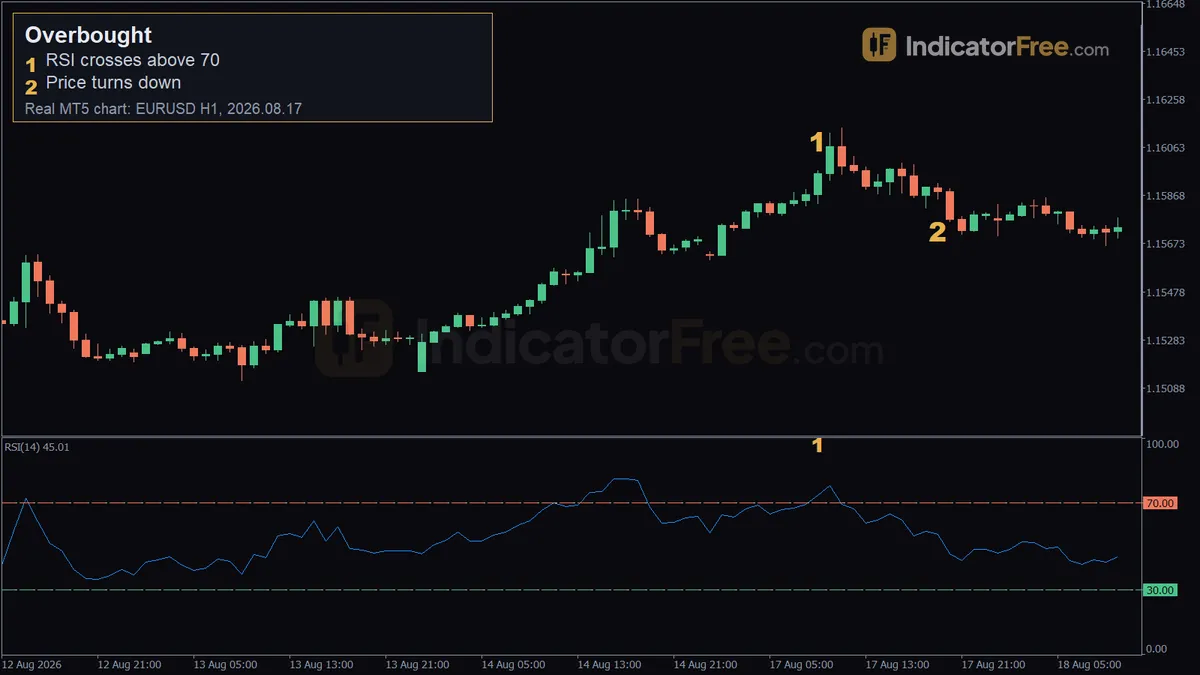
Selling just because the RSI is above 70 is the common costly mistake: in an uptrend the line can stay up there while price keeps climbing against your trade. If price is ranging, an RSI that rolls back under 70 is a fade idea; if price is trending up, ignore it.
Identification: how to flag overbought on a chart
- Add the RSI (Relative Strength Index) to the chart. It is a line that moves between 0 and 100 and measures how strong recent up-moves were against recent down-moves. This is the standard tool for reading overbought conditions.
- Check the broader price trend first. Overbought inside a strong uptrend behaves very differently from overbought inside a range.
- Check the oscillator's period input (for example RSI(14)). A shorter period reaches overbought far more often than a longer one, so the setting changes how the signal behaves.
- Watch for the line to cross above the 70 level. The cross is your alert that the move is stretched; it is not an entry.
- Note the price where the cross happens. In the example below the entry came about 12 pips under the cross price, so part of the move was already gone before the trade started.
- Wait for a second sign that momentum is fading, such as the oscillator rolling back down or price stalling on the chart, before treating the reading as a trade idea rather than just a number.
The illustrative oscillator below shows steps 4 and 6: the line crosses above 70, stays stretched, then rolls back under the level.
Why does the line get above 70 at all? The RSI divides the average gain by the average loss over its period, then turns that ratio into a 0-100 score. The calculation below uses illustrative round numbers: when average gains are three times average losses, the RSI reads 75, inside the overbought zone.
Valid overbought signal vs a weak or broken one
A valid overbought reading combines the cross above 70 with some sign that buying pressure is running out: the oscillator rolling over, price forming a lower high, or momentum slowing on the last few candles.
A weak or broken reading is just the line sitting above 70 while price keeps climbing through a strong uptrend. The RSI can stay high for many candles in that condition, and treating every touch of 70 as a sell signal usually means fighting the trend.
The signal is also weaker when the oscillator barely pokes above 70 and drops straight back below it on the next candle, which is closer to noise than a stretched move.
Use one decision rule. If price is ranging and the RSI rolls back under 70 after several candles above it, then consider a fade. If price is trending up, ignore the reading.
The EURUSD 1-hour example above, marker by marker
The EURUSD 1-hour chart above shows a past example, not a prediction. At 2026.08.17 09:00, the RSI(14) crossed above 70, reaching 73.6, while price traded at 1.15968 — marker 1. Ten hours later, at 2026.08.17 19:00, price turned down at 1.15852 — marker 2. Over the 15 candles that followed the RSI cross, price fell 44 pips. Here the RSI flagged stretched momentum at 09:00, and the turn-down marker came ten candles later at a lower price.
Practical setup
Fading the RSI(14) cross above 70 (EURUSD 1-hour, 2026.08.17)
This setup is read off the chart above; it is not a rule for the next cross.
Entry: a sell on the turn-down at 1.15852 (marker 2), about 12 pips below the 1.15968 price of the RSI cross.
Stop loss: above the swing high that formed before the turn. A new high there would show the up-move is not finished, which cancels the reason for the trade. Read that high off your own chart; the price where the RSI crossed 70 is not a chart level. The example chart does not mark the swing high, so this page cannot give a stop distance or a reward-to-risk figure for it.
Target: the only measured outcome is that price was 44 pips lower 15 candles after the cross at 1.15968. That distance is counted from the cross, not from the entry at marker 2, so it does not show what a trade entered at 1.15852 would have reached. Plan the exit before entry: the nearest support of the range, or when the RSI falls back to the middle of its scale.
When overbought works well, and when to avoid it
| Works well when | Avoid when |
|---|---|
| Price is ranging between support and resistance | Price is in a strong, sustained trend |
| The oscillator has rolled back under 70 after a stretch above it | The oscillator only pokes just above 70 and drops back |
| Paired with a second sign, like a price stall or divergence | Used alone as an automatic sell trigger |
| You know how often your RSI period reaches 70 on this symbol and timeframe | The same period/timeframe combination is assumed to behave the same on every pair |
How often an overbought reading even appears depends heavily on the oscillator period and the instrument. The IndicatorFree Lab counted it over 12 months of past broker demo data (2025-10-02 to 2026-10-02). This is past data, not a forecast.
| Symbol | Timeframe | RSI period | Moves above 70 per month | Candles spent above 70 |
|---|---|---|---|---|
| EURUSD | 1-hour | 7 | 18.2 | 10.6% |
| EURUSD | 1-hour | 14 | 6.1 | 4.7% |
| EURUSD | 1-hour | 21 | 2.8 | 2.3% |
| EURUSD | 4-hour | 14 | 1.6 | 4.4% |
| XAUUSD | 1-hour | 7 | 21.1 | 15.2% |
| XAUUSD | 1-hour | 14 | 9.3 | 8.3% |
| XAUUSD | 1-hour | 21 | 5.3 | 4.8% |
| XAUUSD | 4-hour | 14 | 3.2 | 9.4% |
Candles counted: EURUSD 6222 (1-hour) and 1556 (4-hour); XAUUSD 5917 (1-hour) and 1548 (4-hour).
Across both symbols, shorter RSI periods reach overbought far more often than longer ones, and XAUUSD reaches overbought more often than EURUSD at the same period and timeframe.
The bars below show the EURUSD 1-hour counts side by side.
Overbought flags a possible top; its mirror case, Oversold, flags a possible bottom and has its own entry.
Quick checklist
- A second sign of stalling is present (lower high, oscillator turning down)
- Stop-loss and target are set before entry
- You know which period and timeframe you are reading, since both change how often the signal appears
FAQ
What does overbought mean in the stock market?
The reading and its trend caveat work the same way on a stock chart as on a currency pair or gold. A stock in a strong rally can stay overbought for a long stretch while its price keeps rising, so the reading alone is not a reason to sell it.
How much of the time is a market overbought?
In the Lab table above, the RSI(14) spent 4.7% of all EURUSD 1-hour candles above 70 and 9.4% of all XAUUSD 4-hour candles above it over the 12 months counted. That is total time across the whole period, not the length of one stretch; the Lab did not measure how long a single stretch lasts. The share changes with the symbol, the timeframe and the RSI period.
Should I use 70 or 80 as the overbought level?
70 is the usual level on the RSI. A higher level such as 80 flags fewer and more extreme readings, so it suits a market or a short RSI period that crosses 70 very often. Pick one level, keep it fixed, and judge it over many readings on your own symbol and timeframe.