









Bullish divergence
Also called Positive divergence, Regular bullish divergence, Classic bullish divergence
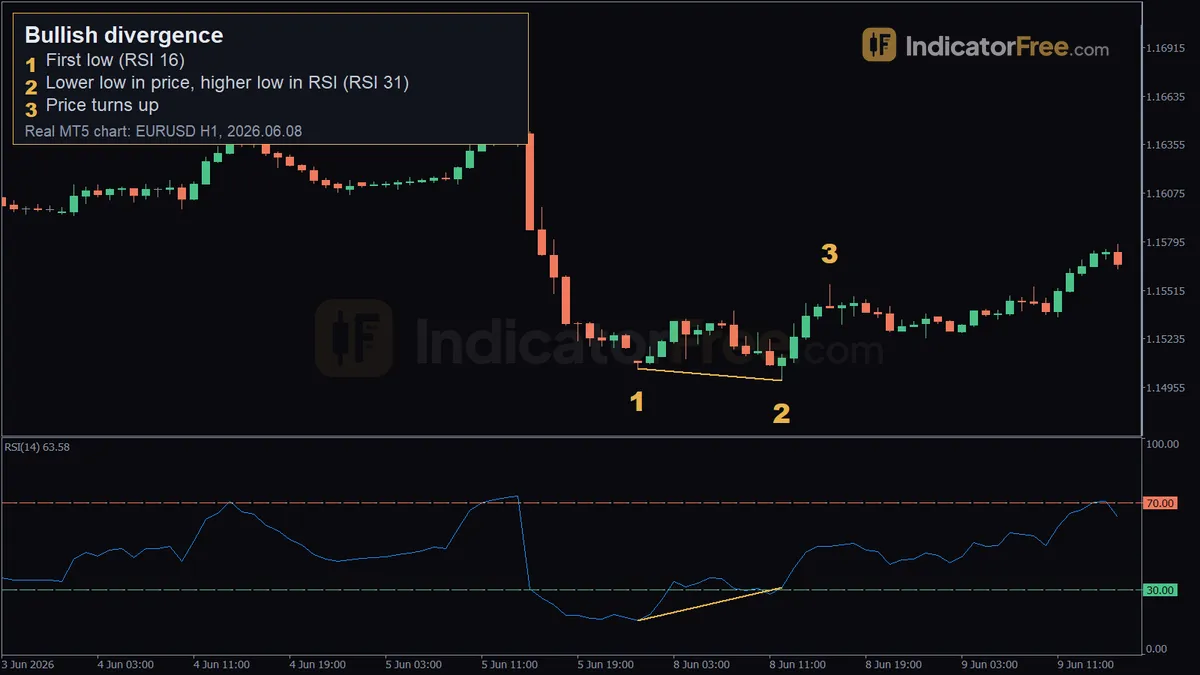
Bullish divergence is when price makes a lower low but an oscillator such as RSI or MACD makes a higher low. It suggests selling pressure is fading and that a bounce or reversal up may follow.
It does not tell you when the fall will end. Traders who buy the moment they see it often get stopped out while price keeps sliding, and the momentum line keeps printing new "divergences" all the way down. The rules below help you separate a usable signal from one you should ignore.
Reading the EURUSD 1-hour bullish divergence, marker by marker
The chart at the top of the page is a past EURUSD example on the 1-hour chart, not a prediction.
- Marker 1, first low (RSI 16): on June 8, 2026 at 00:00, price made a low at 1.15063. RSI fell to 15.9, deep in the oversold zone. Sellers were pushing hard.
- Marker 2, lower low in price, higher low in RSI (RSI 31): at 12:00 the same day, price dipped further to 1.14995, below the first low. RSI only reached 31.2, far above 15.9. Price and momentum moved in opposite directions. That is the divergence, and this low is where price turned up.
- Marker 3 (16:00, 1.15547): price has already climbed back above both lows. From the 1.14995 low, price rose 55 pips.
Notice how small the new low was: 1.15063 − 1.14995 = 0.00068, under 7 pips. Sellers managed only a tiny new low while RSI rose by more than 15 points. A shallow new low with a large rise in momentum is the clearest kind of divergence.
How to spot a bullish divergence: a 7-point checklist
- Find a clear downtrend or pullback. You need at least two swing lows in price. A swing low is a candle low with higher lows on both sides of it.
- Confirm that price made a lower low. The second swing low must sit below the first one.
- Read the oscillator at the same two candles. Use RSI, MACD (its line or histogram), Stochastic or a similar momentum tool.
- Check that the oscillator made a higher low. The second oscillator low must be clearly above the first one.
- Check that both lows belong to the same move. If price made a clear rally between the two lows that broke the prior swing high, they belong to different moves, so do not compare them. In the drawing below, the lows are 7 candles apart and the bounce between them stays well under the earlier highs.
- Prefer a first oscillator low in the extreme zone. For RSI, that means a first low below 30, the oversold area where sellers have pushed hard.
- Wait for price to confirm. A bullish candle close, a reclaim of the first low or a break of the swing high between the two lows turns the warning into a trade trigger.
The drawing below shows the checklist on one chart. The entry uses the strictest trigger, a close above the high between the two lows. The "Entry close" marker shows the first candle to close above the top of the bounce between the two lows.
What makes a bullish divergence weak or broken
A divergence is weak when the oscillator's second low is barely higher than the first. A difference of one or two RSI points is noise, not a change in momentum.
It is also weak when neither oscillator low reached the extreme zone. If RSI only dipped to 45 and 48, sellers were never really in control, so their fading tells you little.
A divergence is broken when price closes clearly below the second low before your trigger appears. It is also broken if the oscillator then drops below its own first low. At that point the momentum story has reversed, so drop the idea.
A common misread: you read the oscillator only at the candle under the price low and skip its real low. Look at the oscillator's lowest point around the second price low too. If that true low sits a few candles away and is below the first oscillator low, there is no divergence, even when the value under the price low looks higher.
Trading setups built on a bullish divergence
Both setups use the same stop: 5 pips below the lower low. The buffer keeps the spread and a quick wick back to the low from closing your trade. If price trades 5 pips through the low, the lower low has failed, not just been tested, and the divergence is broken.
Setup 1: buy when price reclaims the first low
Using the EURUSD example above:
- Entry: wait for a 1-hour candle to close back above the first low, 1.15063. A close back above shows the break to 1.14995 did not hold. In this past example, the 12:00 candle that made the lower low also closed at 1.15125, above the first low, so the trigger came on that same candle.
- Stop loss: 5 pips below the lower low of 1.14995.
- Target: twice the distance from entry to stop. Entry to the lower low is 1.15125 − 1.14995 = 0.00130, or 13 pips. Add the 5-pip buffer and the risk is 18 pips, so the target sits 36 pips above the entry. The 16:00 candle traded up to 1.15547, above that target.
Setup 1 suits a shallow lower low like this one, where sellers fail on the same candle that made the new low. The chart below shows the levels.
Setup 2: buy the break of the high between the two lows
This is the slower, stricter entry, and it matches the drawing above.
- Entry: the first candle that closes above the swing high between the two lows. In the drawing, that is the "Entry close" marker. In the EURUSD example, the highest point between the two lows was 1.15398, on the 08:00 candle. The first close above it came at 15:00, at 1.15420.
- Stop loss: 5 pips below the lower low of 1.14995, as in Setup 1.
- Target: twice the distance from entry to stop. Entry to the lower low is 1.15420 − 1.14995 = 0.00425, or 42.5 pips. Add the 5-pip buffer and the risk is 47.5 pips, so the target sits 95 pips above the entry. In the candles shown here, the rise topped out at 1.15547, so this target was not reached.
The following figures are an illustrative example. You have a $6,000 account, you risk 1%, and your stop sits 60 pips below your entry. On EURUSD, one standard lot (100,000 units) is worth $10 per pip.
The trade-off: Setup 2 enters later and needs a wider stop (47.5 pips against 18 in the EURUSD example). In return, it skips many divergences that never turn into a real rise.
When bullish divergence works and when to avoid it
It tends to work best at the end of a long fall into a level that has held before, such as an earlier support zone or a round number. It also works well when the first oscillator low was deeply oversold, as in the EURUSD example.
Avoid it in a strong downtrend on a higher timeframe. If the daily chart is falling hard, a 1-hour divergence usually produces only a short pause. Also skip it just before major news, when one release can wipe out any momentum reading.
| Pros | Cons | |
|---|---|---|
| Timing | Warns before price turns | Can repeat several times before any turn |
| Rules | Clear, checkable conditions | Choosing swing lows involves judgment |
| Flexibility | Works with RSI, MACD, Stochastic, any market | Weak in strong trends and news spikes |
Bullish divergence vs bearish and hidden divergence
The bullish version is the one covered here: a lower low in price with a higher low in the oscillator, read as a possible turn up. The bearish version is the mirror image at highs and is covered in its own glossary term, Bearish divergence. A related pattern, hidden bullish divergence (a higher low in price with a lower low in the oscillator), is read as a sign that an uptrend may continue, not as a reversal.
Practical tips for trading bullish divergence
- Never add to a losing position because of a new divergence. If price makes another lower low after your entry, your stop decides, not the oscillator.
- Use lows that have closed. Until the candle and the oscillator value are final, the second low can still move.
- Pick one oscillator and stick with it. Checking RSI, MACD and Stochastic until one shows a divergence is just confirming what you already want to see.
- Size from the stop, not from the signal. Work out the lot size from the stop distance, as in the example above, before you place the order.
FAQ
What is bullish divergence on MACD?
It follows the same rule. Price makes a lower low while the MACD line, or the MACD histogram, makes a higher low. Histogram divergences show up more often but are less reliable. Line divergences are rarer and slower.
Does bullish divergence work in crypto, such as XRP?
The rule is the same on any market with a price chart. Crypto trades around the clock and often moves sharply, so the gap between the two lows can be large. That makes the stop below the lower low wider, so reduce your position size.
How many candles apart can the two lows be?
There is no fixed number. In the drawing above the lows are 7 candles apart, and in the EURUSD example they are 12 one-hour candles apart (00:00 to 12:00). As a rough rule, if you have to scroll back so far that the first low is off your screen, the two lows probably no longer relate to each other. Compare lows on a higher timeframe instead.
Which timeframe is best for bullish divergence?
Signals on the 4-hour and daily charts appear less often but tend to carry more weight. On the 1-minute and 5-minute charts, divergences appear constantly and most fail. Many traders find the 1-hour chart a workable middle ground.