MACD histogram
Also called OsMA, MACD-Histogram, MACD bars
The MACD histogram is a bar chart under price that shows the gap between the MACD line and its signal line. Bars above zero mean MACD is above its signal. Growing bars mean momentum is building, and shrinking bars mean it is fading.
The histogram reacts sooner than the MACD line does. That makes it useful for timing entries and exits. On EURUSD 1-hour with default settings it flipped about 43 times a month in the past year, so trading every flip means paying the spread on dozens of mostly noise trades.
What the MACD histogram bars measure
The histogram is built in three steps. The MACD line is a fast exponential moving average of closing prices minus a slow one. The signal line is an average of the MACD line. The histogram is the MACD line minus the signal line, drawn as one bar per candle.
This means a bar crosses zero at the exact moment MACD crosses its signal line. The height of a bar shows how far apart the two lines are. A tall bar means the fast average is pulling away. A short bar means the two lines are coming back together.
The chart below shows how a typical turn looks. The red bars shrink, the bars flip to green, they peak, and then they shrink again.
The MT5 default settings are a fast EMA of 12, a slow EMA of 26 and a signal SMA of 9, applied to Close. Some platforms, MT5 among them, draw the MACD line itself as bars and the signal as a line, so those bars are not MACD minus signal.
This is the most common misread. Here is how to check which kind you are looking at. If there are two lines plus bars, and the bars touch zero exactly where the lines cross, you have the true histogram. If there is one line running through the bars, the bars are the MACD line, and a bar crossing zero means MACD crossed zero instead.
How to identify a MACD histogram signal
- Confirm what the bars show: MACD minus signal, or the MACD line itself.
- Note your settings. Faster settings give more flips.
- Read which side of zero the bars are on. That tells you whether MACD is above or below its signal.
- Read the slope. Are the bars growing or shrinking compared with the bar before?
- Check where the MACD line sits compared with zero. That is the broader trend context.
- Wait for the candle to close. Until then, the last bar can still change height and even colour.
What makes a histogram flip strong or weak
A strong flip comes after a clear pullback in a trend. The new bars grow quickly over several candles, and the MACD line is already on the same side of zero as the flip. Price makes a fresh swing in the same direction.
A weak or broken flip happens when tiny bars wobble around zero while price moves sideways. A flip printed just before a major news release is also weak, because the next candle can erase it.
Reading the EURUSD 1-hour example at the top
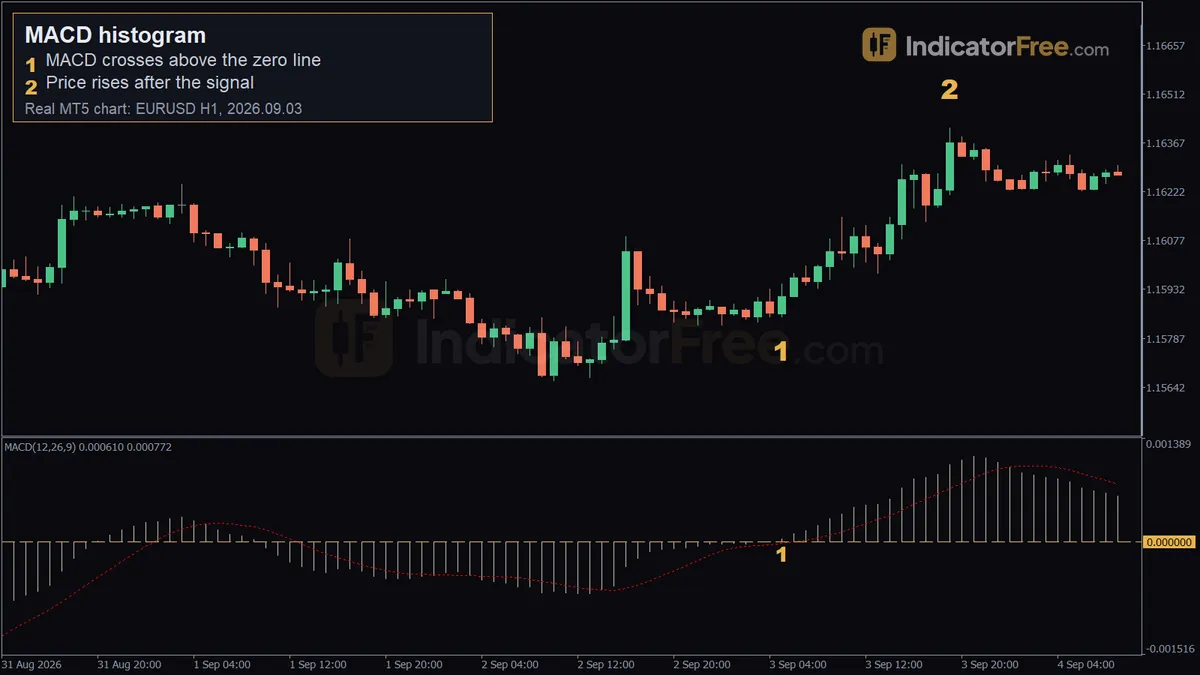
The chart at the top is a past EURUSD 1-hour example, not a prediction. It uses MACD (12, 26, 9) on a platform that draws the MACD line as bars. That means the event shown is the MACD line crossing zero.
Marker 1: On 2026.09.03 at 05:00, MACD crossed above the zero line at 1.15852. This is when the 12-period EMA moved above the 26-period EMA. The bars turn positive here.
Marker 2: By 19:00 the same day, 14 candles later, price had reached 1.16411. Over the full 20 candles after the signal, price rose about 50 pips.
On a true MACD-minus-signal histogram, the flip above zero usually comes earlier in a turn like this. That is because MACD crosses its signal before it climbs all the way to zero. So you get an earlier signal, but more of those signals will be false.
How often the histogram flips: past Lab counts
Every histogram flip is a signal-line cross. The IndicatorFree Lab counted these crosses on 12 months of broker demo data, from 2025-10-02 to 2026-10-02. This is past data, not a forecast.
On EURUSD 1-hour, the MACD line crossed zero 17.6 times a month, while the true histogram flipped 43.3 times. If your bars are really the MACD line, you will see far fewer flips than a guide written for the true histogram leads you to expect.
Here is a rule you can use. On the 1-hour chart, only take a flip in the direction the 4-hour MACD line points: above zero for buys, below zero for sells. Faster settings such as 5/35/5 nearly double the count, so add a filter before you use them.
MACD histogram trading setups with entry, stop and target
Setup 1: trend pullback flip
Use this when the MACD line is above zero and price is in an uptrend. During the pullback, the histogram drops below zero. Buy at the close of the first green bar after the flip. Put your stop below the pullback's swing low. Target twice your risk, or the prior swing high if it is closer.
In this illustrative example, every figure is a round number:
- You buy EURUSD and put your stop 25 pips below your entry, under the pullback's swing low.
- On a $10,000 account risking 1%, you can lose $10,000 × 1% = $100.
- One standard lot (100,000 units) is worth $10 per pip, so your size is $100 ÷ (25 × $10) = 0.40 lots.
- A target at twice the risk is 25 × 2 = 50 pips above your entry. If price reaches it, you make 50 × $4 = $200.
Setup 2: histogram divergence fade
Price makes a higher high, but the tallest green bar on that push is shorter than the tallest bar on the push before. That is histogram divergence: the trend is still going, but with less force behind it. Sell at the close of the first red bar after the second high. Put your stop just above that high. Target the low between the two highs.
The chart below shows the setup on an illustrative price scale: the higher high on top, the shorter green peak underneath, and the first red bar that triggers the sell.
When the MACD histogram helps and when to ignore it
The histogram works best in markets that trend with clean pullbacks, and on 4-hour or higher charts where flips are rarer. It is also a good exit tool. On a buy, if bars shrink for three closed candles in a row, move your stop to the last swing low.
Ignore it in tight ranges, in the hour around major news, and on fast charts with fast settings, where most flips are noise. Remember too that it measures momentum, not price levels. A green bar does not tell you where support is.
| Pros | Cons | |
|---|---|---|
| Timing | Turns before the MACD line | Gives more false turns |
| Momentum strength | Bar height shows how strong momentum is | Exiting on shrinking bars can cut short a trend that pauses and then continues |
| Markets | Same rules on any pair or metal | Fails in sideways markets |
Practical tips for trading the MACD histogram
- Compare bar heights only on the same chart and the same settings. Heights mean nothing between pairs.
- If you change settings, count the flips over the last month first so you know how much extra noise you have added.
Quick checklist
- Are the bars MACD minus signal, or the MACD line?
- Did the candle close?
- Does the flip agree with the higher-timeframe MACD line?
- Is your stop beyond the last swing, and is your size set by the stop?
FAQ
Can I set an alert for a histogram flip?
Yes. On most charting platforms, set an alert for MACD crossing its signal line. That is the same event as the histogram crossing zero.
Why does my histogram look different from someone else's on the same pair?
Check three things: the settings, whether the signal line is a simple or an exponential average, and whether their bars show the MACD line or MACD minus signal. Different broker price feeds also change the candles slightly, which changes the bars.