









Signal line
Also called MACD signal line, Trigger line, Signal line crossover
A signal line is a moving average of an indicator's own line, such as the 9-period average of the MACD line. When the indicator crosses above or below it, traders read it as a change in momentum.
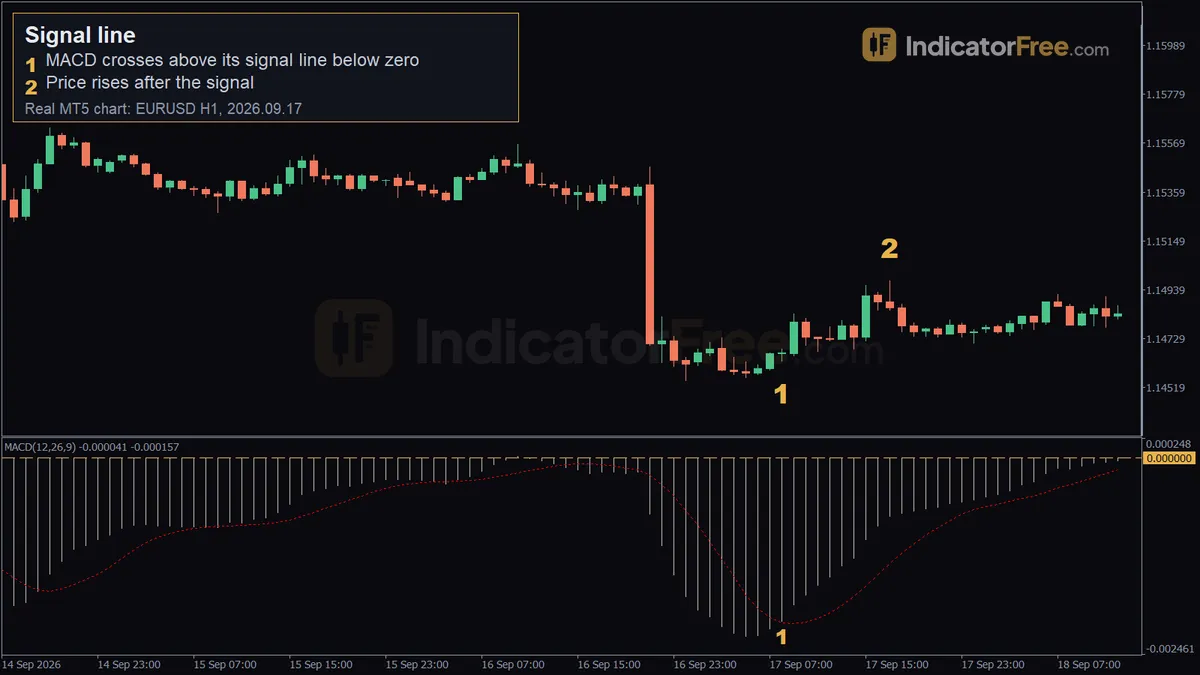
Trading every cross is how this line costs you money. On a 1-hour chart it gets crossed dozens of times a month, so the real skill is knowing which crosses to trust and where your stop goes.
Why the signal line trails the indicator
The signal line is a smoothed copy of the main line. With MACD (12, 26, 9), the MACD line is the gap between a 12-period and a 26-period exponential moving average of price. The signal line is a 9-period average of that MACD line. Since it averages the MACD line, it always runs a step behind it.
That delay is the whole idea. When the faster line pulls away from its own average, momentum is speeding up in that direction. MACD above the signal line means upside momentum is currently stronger than its recent average. It does not mean price has to rise.
A bullish cross is the main line crossing above its signal line. A bearish cross is the main line crossing below it. The MACD histogram is the MACD line minus the signal line, drawn as bars above and below zero.
Other oscillators work the same way. On the Stochastic oscillator, %D is the signal line for %K. An RSI signal line is a moving average that some traders add on top of RSI. It is optional and not part of standard RSI.
The chart below shows price sliding to a low, then the faster line turning up through its signal line while both sit below zero.
Checklist for spotting a signal line cross
- Find both lines: the main indicator line and its slower, smoother signal line.
- Wait for the candle to close. A cross on a candle that is still forming can undo itself before the close.
- Confirm the main line has moved from one side of the signal line to the other.
- Note where the cross happened: below or above the zero line. On bounded oscillators, note whether it was in the oversold or overbought zone.
- Over the next one or two closed candles, the histogram bars should grow away from zero, not shrink back toward it.
What makes a cross valid, weak or broken
A valid cross has room behind it. The lines were clearly apart before the cross and then meet at a visible angle. A turn up below zero, or a turn down above zero, usually comes after a stretched move, so it catches the moment that move runs out of fuel.
A weak cross happens when both lines are flat and hugging zero. That is a range. The lines will braid together and cross again within a few candles. A cross against the trend on a higher timeframe is also weak, because you are trading a pause in the trend, not a turn.
A broken cross reverses on the next closed candle, or it is one you acted on before the candle closed. Treat it as no signal. Do not jump back in on the re-cross inside the same tangle.
Reading the EURUSD 1-hour example, marker by marker
The chart at the top of the page is a past EURUSD 1-hour example using MACD (12, 26, 9). It shows what happened then. It is not a prediction.
Marker 1 (2026.09.17 08:00, 1.14633). The MACD line crosses above its signal line while both are below zero. Momentum had been falling, and the faster line turned up first. This is the cross-below-zero shape from the checklist.
Marker 2 (2026.09.17 17:00, 1.14977). Price is higher nine candles later. 1.14977 − 1.14633 = 0.00344, which is 34.4 pips. Price closed lower than marker 2 by candle 20, so the move from the signal to candle 20 was 31 pips.
Notice what the cross did not tell you: how far the move would go. The cross timed the turn. Your exit needs a separate rule.
Two ways to trade a signal line cross
Setup 1: cross on the far side of zero, with the higher-timeframe trend
The top chart shows only the entry for this setup (marker 1). The stop and target come from the swing low and the 2× rule, which that chart does not mark.
- Entry: buy at the close of the candle where MACD crosses above its signal line below zero, but only if the 4-hour chart is making higher highs. For sells, do the mirror image above zero.
- Stop loss: a few pips beyond the last swing low before the cross.
- Target: at least twice your stop distance. Close any remaining position on the opposite cross.
Setup 2: re-cross after a pullback in a trend
- Entry: in an uptrend, MACD mostly stays above zero. A pullback pushes MACD under its signal line. When MACD crosses back above the signal line while still above zero, buy at the candle close.
- Stop loss: below the low of the pullback.
- Target: the previous swing high first, then trail the stop under each new swing low.
The numbers that follow are an illustrative example. Your account holds $5,000 and you risk 1% per trade. Setup 1 gives a EURUSD buy with the swing low 25 pips below your entry, and your target sits 50 pips above it. One standard lot (100,000 units) on a USD-quoted pair is worth $10 per pip.
How often the signal line is crossed: Lab counts
The IndicatorFree Lab counted crosses on 12 months of broker demo data, from 2025-10-02 to 2026-10-02. This is past data, not a forecast. On EURUSD 1-hour (6,222 candles), MACD 12/26/9 crossed its signal line 43.3 times a month and the zero line 17.6 times. That works out to about 2.5 signal crosses for every zero-line cross.
The faster 5/35/5 setting raises the count about 1.8 times, to 77.9 a month on EURUSD 1-hour. Moving to the 4-hour chart cuts 12/26/9 to 10.3 a month (1,556 candles). XAUUSD gives similar counts: 40.3 on the 1-hour chart and 10.8 on the 4-hour chart.
Decision rule: if you can only review about ten setups a month, use the 4-hour chart, where 12/26/9 crossed about 10 times a month.
When signal line crosses work and when to skip them
Crosses are easier to manage on the 4-hour chart, where the Lab counted about a quarter as many. Skip them right after a news spike, because the averages react only once the move has already happened.
| Pros | Cons |
|---|---|
| Gives an exact trigger on a closed candle | Lags price, because it is an average of an average |
| Works on any market and timeframe | Fires very often on short timeframes |
| Where it sits relative to zero adds context | The signal line can use a simple or an exponential average, so crosses differ between charts |
| Easy to pair with a trend filter | Whipsaws in sideways markets |
Practical tips for trading signal line crosses
- Set your stop at a price level, not at "the opposite cross". The opposite cross often comes late, after price has already moved against you.
- Bars shrinking toward zero warn you that a cross is getting close.
- Before you change settings, check how often they fire. Faster settings mean more crosses to filter, not better ones.
- Log each cross you take: its timeframe, where it sat relative to zero, and the result. After 30 trades your own notes will tell you which crosses to drop.
FAQ
Why does my MACD signal line look different on another chart?
Some charts calculate the signal line with a simple moving average and others use an exponential one. Small differences in price data between feeds also shift the lines. Check that both charts use the same settings and averaging method before you compare crosses.
Do signal line crosses work on stocks, indices and crypto?
The maths is the same on any price series, so the line behaves the same way. What changes is how often it crosses and how large the moves are. Count the crosses on your own market before you trust a rule you built on another one.