MACD
Also called Moving Average Convergence Divergence, MACD Oscillator
MACD (Moving Average Convergence Divergence) is an MT5 momentum oscillator that compares a fast and a slow EMA to show when price momentum is turning.
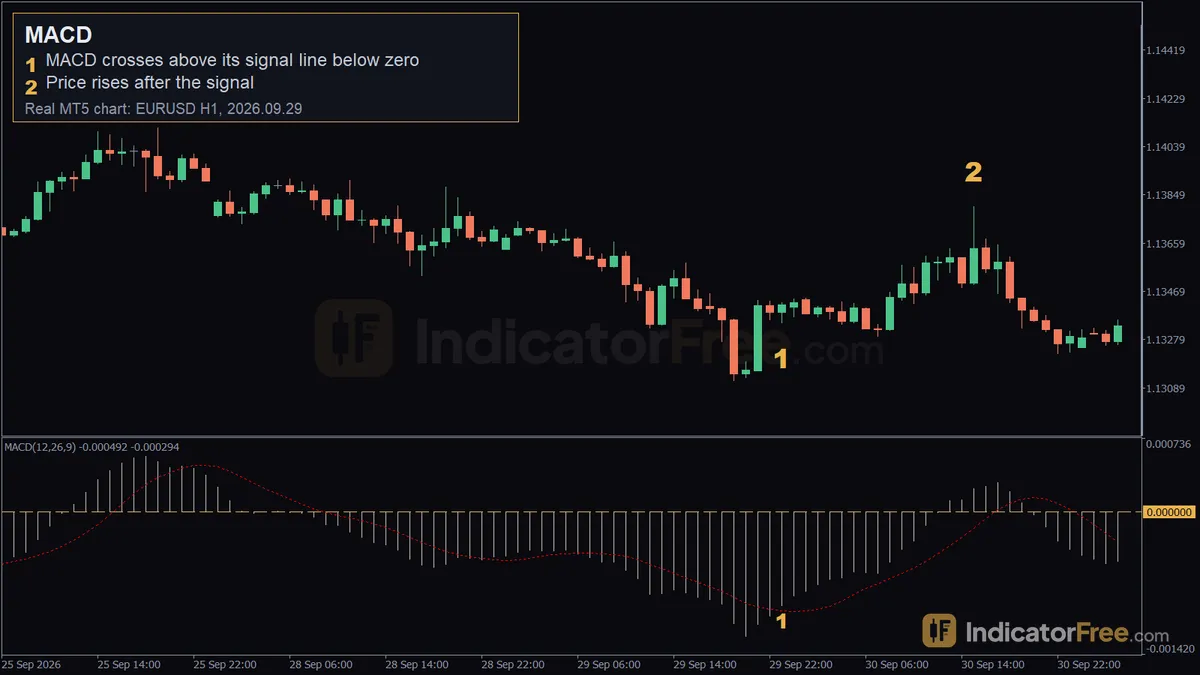
MACD plots the gap between a fast and a slow exponential moving average of price, smooths that gap with a signal line, and marks a zero line where the two EMAs are equal. On an MT5 chart it sits in a window below price. Traders watch its crosses and its slope to time entries around shifts in momentum rather than reading price alone.
Anatomy of MACD on an MT5 chart
MT5 draws MACD with two parts in the sub-window:
- MACD line – the difference between the fast EMA (default 12) and the slow EMA (default 26) of the Close price. In MT5 this value is drawn as the histogram, so the bars above and below the zero line are the MACD line itself, not the gap between MACD and signal.
- Signal line – a simple moving average of the MACD value (default 9 periods), drawn as a solid line over the histogram. It smooths the MACD line so crosses between the two stand out.
- Zero line – the level where the fast EMA and slow EMA are equal. MACD above zero means the fast EMA is above the slow EMA (upward bias over that lookback); below zero means the opposite.
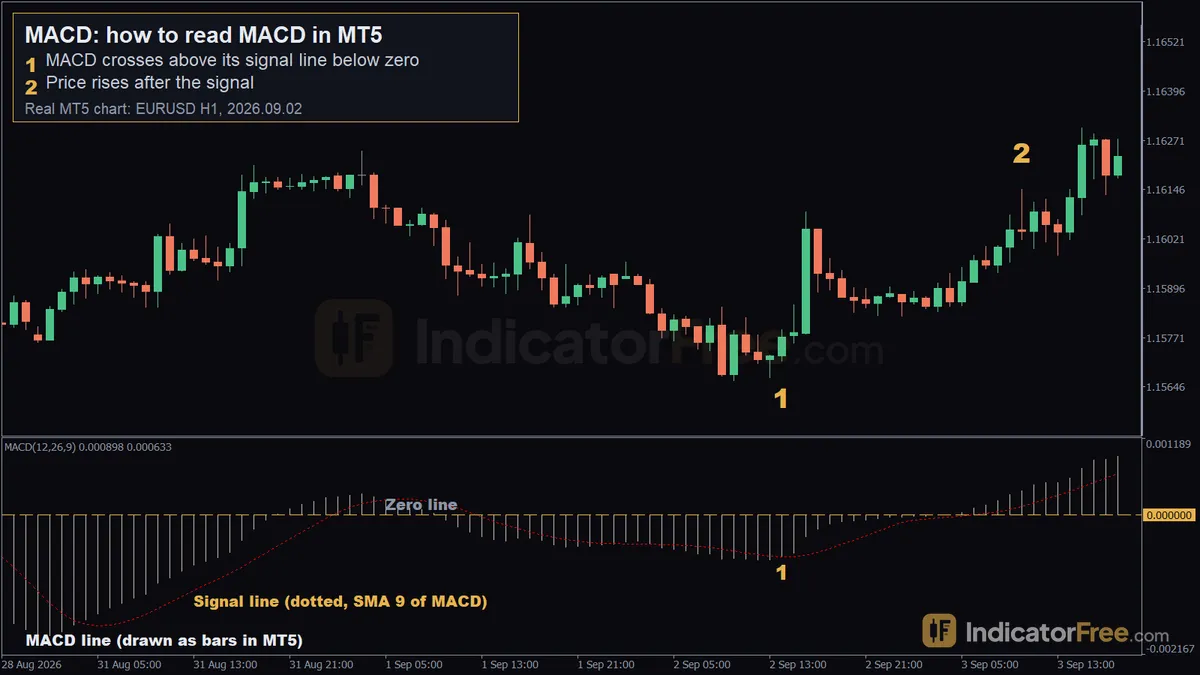
MACD, how to read MACD in MT5: real EURUSD H1 MT5 chart (2026-09-02).
In that image, on EURUSD H1, the MACD (12, 26, 9) line crossed above its signal line while both sat below zero at 2026.09.02 14:00, price near 1.15712. Over the next 20 candles price rose to 1.16147 by 2026.09.03 10:00, a 37-pip move. This is a past example, not a prediction of future behaviour. The chart at the top of this page shows the same pattern on a different date: a signal-line cross below zero on 2026.09.29 23:00 at 1.13346, followed by a 39-pip rise to 1.13803 by 2026.09.30 15:00.
MT5 inputs
| Input | MT5 default | What changing it does |
|---|---|---|
| Fast EMA period | 12 | Shortening it makes the MACD line react faster to recent price, producing more crosses; lengthening it slows the line down. |
| Slow EMA period | 26 | A larger value makes the MACD line track a longer-term average, so crosses with the signal line happen less often; a smaller value brings the fast and slow EMA closer together and increases crosses. |
| Signal SMA period | 9 | A shorter signal line hugs the MACD line more closely and triggers earlier, noisier crosses; a longer one delays the cross but filters out some of the smaller wiggles. |
| Applied price | Close | Switching to another price (such as Open or Median) changes which price point each EMA is calculated from, shifting exactly when the lines cross. |
Signal: MACD line crosses the signal line
When the MACD line (the histogram in MT5) crosses above the signal line, momentum is turning up; when it crosses below, momentum is turning down. The location of the cross matters: a cross that happens below the zero line is a turn inside a weak or bearish stretch, while a cross above zero happens inside an already positive stretch.
Signal: MACD crosses the zero line
A zero-line cross happens when the fast EMA and slow EMA themselves cross, since MACD is just their difference. This is a slower, less frequent signal than a signal-line cross, because the two EMAs have to actually swap positions, not just the smoothed average of their difference.
Signal: MACD divergence
Divergence is when price makes a new high or low but the MACD line does not confirm it with a matching new high or low. It flags that the move is losing momentum even though price is still extending, and is normally read alongside price structure rather than on its own.
When MACD works well
- In a market that is already trending, where momentum shifts tend to line up with real price swings.
- On higher timeframes such as H4, where the Lab recorded far fewer signal-line and zero-line crosses per month than on H1, meaning fewer signals to sort through.
- Combined with a trend filter, so only signals in the direction of the larger trend are considered.
When to avoid it
- In a tight, sideways range, where the MACD line and signal line cross back and forth with no follow-through.
- On short timeframes with faster settings such as 5/35/5, which the Lab measured crossing its signal line far more often than the 12/26/9 default on the same symbol and timeframe.
- Right around high-impact news or price gaps, where the EMAs that feed MACD can swing sharply without a real change in underlying momentum.
Pros and cons
| Pros | Cons |
|---|---|
| Built into MT5 by default, no installation needed | Based on EMAs, so it reacts after price has already moved, not before |
| Gives two distinct signal types (signal-line cross and zero-line cross) | Signal-line crosses can be frequent in choppy conditions |
| Works the same way across any MT5 symbol or timeframe | Divergence can persist for a long time before price actually turns |
| Easy to combine with a trend filter like a moving average | Default settings are not tuned to any single pair or timeframe |
Practical setups
//Setup: signal-line cross below zero
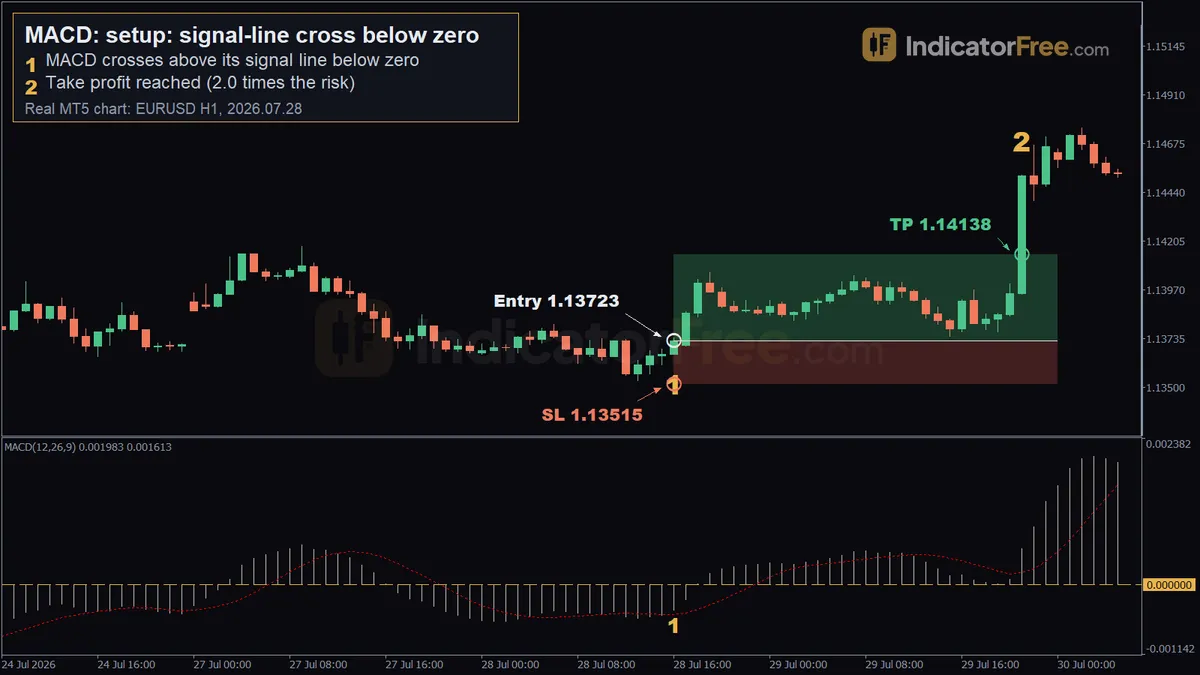
MACD, setup: signal-line cross below zero: real EURUSD H1 MT5 chart (2026-07-28).
On EURUSD H1, the MACD (12, 26, 9) line crossed above its signal line while both were below zero at 2026.07.28 16:00, price near 1.13658. Price then rose 33 pips over the next 20 candles. In this past example a buy was entered at 1.13723 on 2026.07.28 16:00, with a stop loss at 1.13515 (21 pips of risk) and a take profit at 1.14138 (2.0R), which was reached on 2026.07.29 21:00.
//Setup: zero-line cross
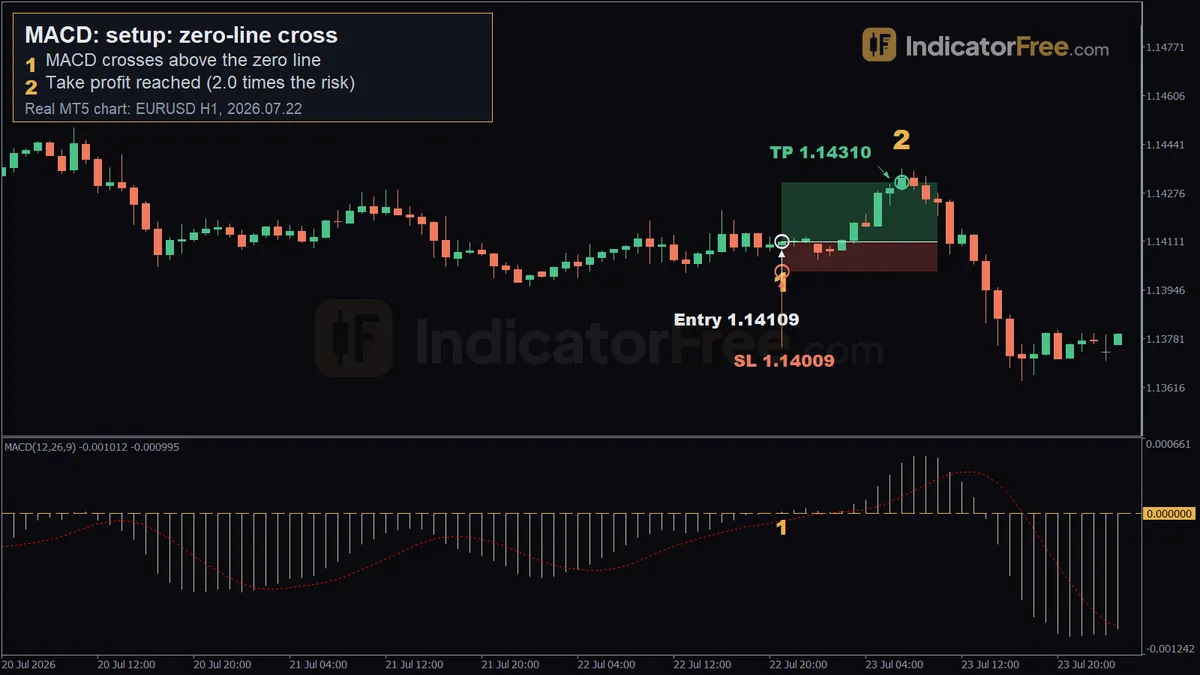
MACD, setup: zero-line cross: real EURUSD H1 MT5 chart (2026-07-22).
On EURUSD H1, the MACD (12, 26, 9) line crossed above the zero line (the 12-period EMA moving above the 26-period EMA) at 2026.07.22 21:00, price near 1.1408. Price rose 25 pips over the next 20 candles. In this past example a buy was entered at 1.14109 on 2026.07.22 21:00, stop loss at 1.14009 (10 pips of risk), take profit at 1.14310 (2.0R), reached on 2026.07.23 07:00.
//Setup: MACD with an EMA 200 filter
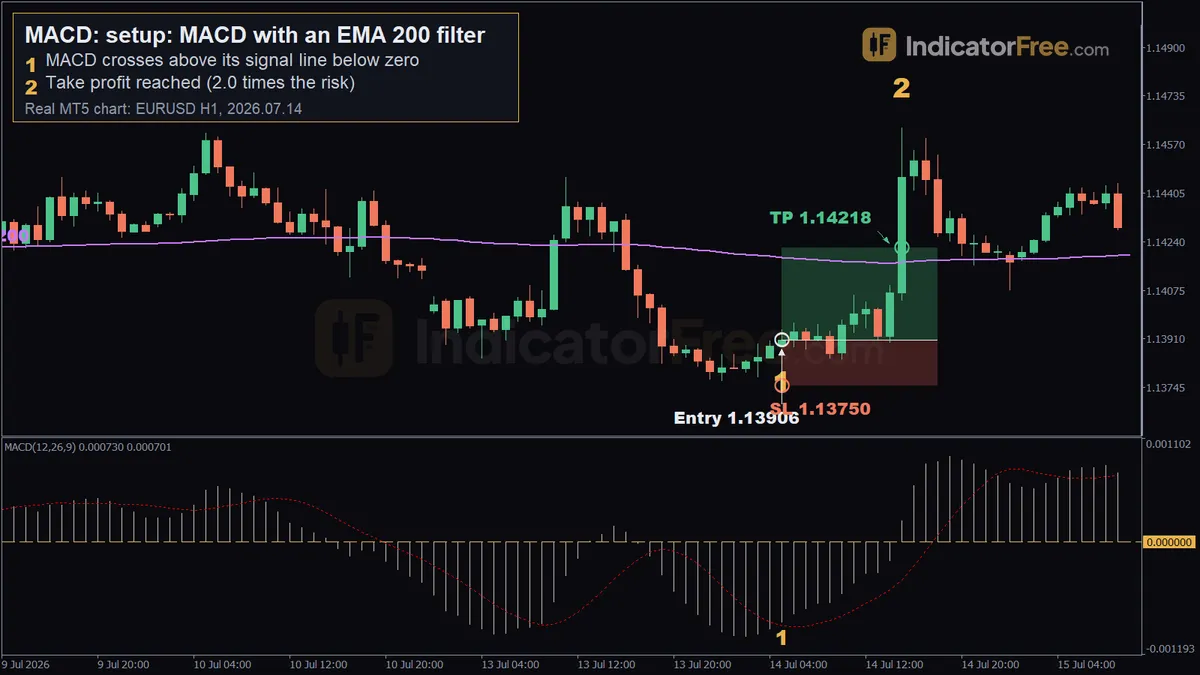
MACD, setup: MACD with an EMA 200 filter: real EURUSD H1 MT5 chart (2026-07-14).
On EURUSD H1, the MACD (12, 26, 9) line crossed above its signal line while both were below zero at 2026.07.14 05:00, price near 1.13888. Price rose 72 pips over the next 20 candles. At that moment price (1.13906) was actually below the EMA 200 (1.14187) — so a rule that only takes bullish MACD signals when price sits above the EMA 200 would have skipped this particular trade, even though the move still went up. In this past example a buy was entered at 1.13906, stop loss at 1.13750 (16 pips of risk), take profit at 1.14218 (2.0R), reached on 2026.07.14 15:00.
Choosing MACD settings by trading style
| Trading style | Typical timeframe | Setting to consider |
|---|---|---|
| Scalping | M5–M15 | Faster settings such as 5/35/5, accepting many more signal-line crosses to sort through |
| Day trading | H1 | Default 12/26/9, with the zero-line cross used to confirm a signal-line cross |
| Swing trading | H4 | Default 12/26/9; the Lab recorded far fewer crosses per month on H4 than H1 for the same pair |
| Position trading | H4 and above | Default 12/26/9, read mainly for zero-line crosses and divergence over several weeks |
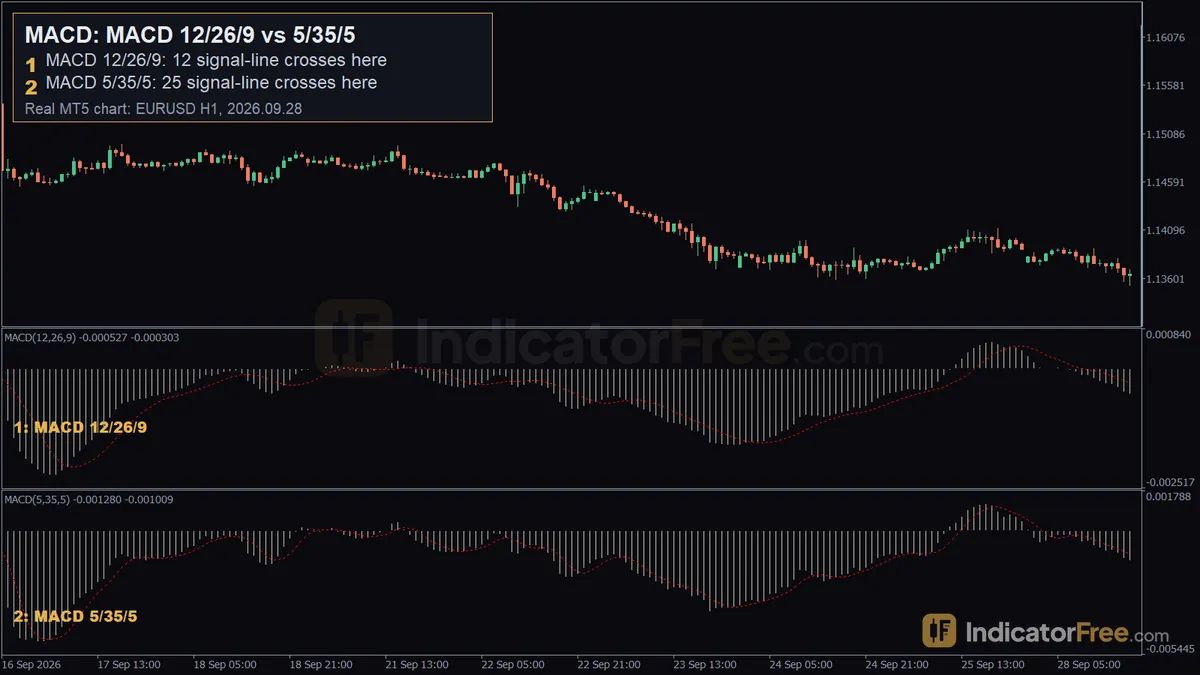
MACD, MACD 12/26/9 vs 5/35/5: real EURUSD H1 MT5 chart (2026-09-28).
On EURUSD H1, across 190 candles from 2026.09.16 19:00 to 2026.09.28 17:00, the default MACD (12/26/9) crossed its signal line 12 times, while MACD (5/35/5) crossed its signal line 25 times over the same stretch — roughly double the signals from the faster setting. On gold versus EURUSD, the Lab's monthly crossover counts on H1 (around 40–43 signal-line crosses and 16–17.6 zero-line crosses per month for the default setting on both symbols) were close to each other, so the default settings behave similarly in terms of how often they fire; what differs is that gold's price swings per pip are larger, so a stop or target sized the same way in pips carries different risk than it would on a major FX pair (this comparison is hypothetical, not from the Lab's price data).
Combining MACD with an EMA 200 filter
A common way to cut down on signal-line crosses that fire against the larger trend is to only act on a bullish MACD signal when price is above a long moving average such as the EMA 200, and only act on a bearish signal when price is below it. The setup above shows why this matters in practice: a MACD buy signal fired while price was still below the EMA 200, so a strict filter would have passed on that trade. The filter does not make MACD signals more or less likely to move in the signalled direction on their own — it simply removes signals that disagree with the longer-term trend direction defined by the moving average.
What the Lab measured
The IndicatorFree Lab counted MACD signal-line and zero-line crosses per month on four symbol/timeframe combinations (past data, not a forecast):
- EURUSD H1: MACD 12/26/9 crossed its signal line 43.3 times and the zero line 17.6 times per month; MACD 5/35/5 crossed its signal line 77.9 times and the zero line 24.4 times per month.
- EURUSD H4: MACD 12/26/9 crossed its signal line 10.3 times and the zero line 4.9 times per month; MACD 5/35/5 crossed its signal line 20 times and the zero line 6.3 times per month.
- XAUUSD H1: MACD 12/26/9 crossed its signal line 40.3 times and the zero line 16.3 times per month; MACD 5/35/5 crossed its signal line 74.6 times and the zero line 22.1 times per month.
- XAUUSD H4: MACD 12/26/9 crossed its signal line 10.8 times and the zero line 4.3 times per month; MACD 5/35/5 crossed its signal line 19.7 times and the zero line 4.9 times per month.
These counts show how much more often the faster 5/35/5 setting fires compared with the 12/26/9 default, and how much quieter H4 is than H1 on both symbols.
Practical tips
- Treat a signal-line cross below zero and a signal-line cross above zero differently — the first follows a weak stretch, the second follows a strong one.
- Use the zero-line cross as a slower confirmation of a signal-line cross rather than trading it as a separate, earlier entry.
- On H1, expect more signal-line crosses than on H4 for the same symbol — plan how many signals you can realistically review before switching timeframes.
- If using the 5/35/5 setting, expect roughly double the signal-line crosses of the 12/26/9 default on the same chart, based on the Lab's counts.
- Check where price sits relative to a longer moving average before acting on a MACD cross, since the cross itself says nothing about the larger trend direction.
- Read divergence against price structure (recent swing highs or lows), not against the MACD line alone.
Quick checklist
- Which line crossed — MACD over signal, or MACD over zero?
- Is the cross above or below the zero line?
- Does price sit on the trend side of a longer moving average filter, if you use one?
- Does the timeframe and MACD setting match how many signals you can actually track?
Not to be confused with
A MACD signal-line or zero-line cross is not the same thing as a "death cross" or "golden cross." Those terms describe a cross between two moving averages plotted directly on the price chart (commonly a 50-period and 200-period average), not the MACD oscillator in the sub-window. MACD is built from two EMAs internally, but what it plots and what a death cross plots are different objects on different parts of the chart.
FAQ
Does MACD work the same way in stocks and in forex pairs on MT5? Yes — MACD is calculated from the Close price (or whichever applied price is selected) of whatever symbol it's attached to, so the same fast EMA, slow EMA, and signal SMA logic applies whether the chart is a stock, a forex pair, or gold.
Is MACD a leading or a lagging indicator? It is lagging. Because it is built from exponential moving averages of past price, MACD confirms a shift in momentum after some of the price move has already happened, rather than predicting the move in advance.