Zero line
Also called Zero level, Centre line, Midline, Zero axis
The zero line is the horizontal 0 level on oscillators such as MACD, momentum and CCI. When the indicator crosses above it, momentum has turned up. When it crosses below it, momentum has turned down.
On MACD, the line sits exactly at zero when the 12-period and 26-period exponential moving averages (EMAs) are equal. A zero-line cross is really a moving-average crossover drawn in a separate panel. It confirms a shift that has already started, so it will never catch the first pips of a move. Use it to decide which side to trade, not as a buy or sell button.
What the zero line measures on MACD and other oscillators
The MACD line is the 12-period EMA minus the 26-period EMA. When it is above zero, recent prices average higher than older prices. When it is below zero, the opposite is true. The further the line sits from zero, the stronger that gap is.
Other oscillators centred on zero work the same way. Momentum and rate of change compare today's price with the price a set number of candles ago. Some platforms draw Momentum around 100 instead of 0; there, 100 plays the role of the zero line. CCI and the Awesome Oscillator also swing above and below 0. RSI and Stochastic run from 0 to 100, so they use the 50 level as their midline instead.
A common misread: the MACD histogram crossing zero is not a zero-line cross. The histogram shows the gap between the MACD line and its signal line. So a histogram flip only means the MACD line crossed its signal line. To spot a real zero-line cross, check whether the MACD line itself has moved to the other side of 0.
Reading the EURUSD 1-hour zero-line example
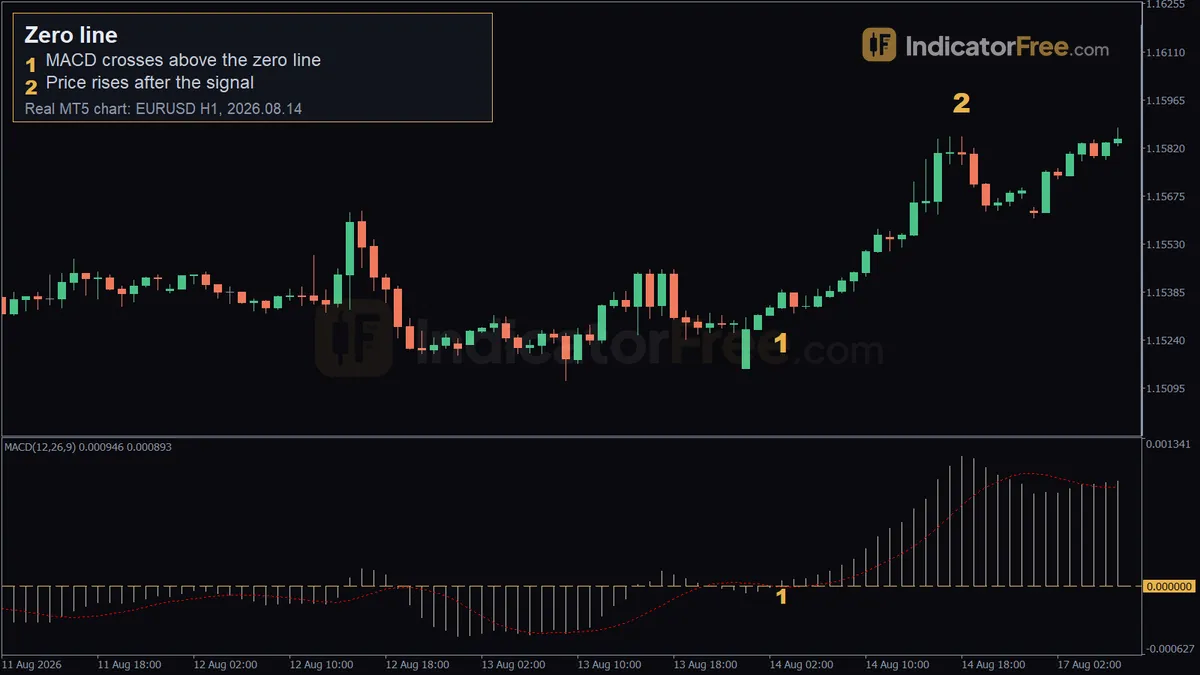
The chart at the top of the page is a past example from the EURUSD 1-hour chart, not a prediction.
- Marker 1: on 2026.08.14 at 03:00, the MACD (12, 26, 9) line crossed above zero with price at 1.15335. At that candle, the 12-period EMA moved above the 26-period EMA.
- Marker 2: at 18:00 the same day, price reached 1.15853. Over the 20 candles after the signal, price rose 47 pips.
Now look at what the cross missed. The swing low came at 00:00, at 1.15154. By the 03:00 cross, price was at 1.15335. So about 18 pips (1.15335 − 1.15154 = 0.00181) had already passed before the signal. That is the lag: the short average needs several rising candles before it overtakes the long one.
Then check the cross against the checklist below:
- Closed candle (step 3): met. The 03:00 candle closed at 1.15383, with the line already above zero.
- Slope (step 4): slow start. The next three candles closed at 1.15341, 1.15343 and 1.15372. Price held above the cross level but did not pull away yet.
- Price above the prior highs (step 5): not met at the cross. The 13 August highs topped out at 1.15454, and the 03:00 candle reached only 1.15392. Price cleared that level at 10:00, when the candle closed at 1.15508.
If you wait for every point, your entry moves to the 10:00 close. That is later again, but price has now confirmed the cross.
How to identify a zero-line cross: 6-point checklist
- Confirm the oscillator is centred on zero (or on 100 for ratio-style momentum). If it runs 0-100, use 50.
- Watch the MACD line, not the histogram or the signal line.
- Wait for a candle to close with the line on the new side of zero. A cross that only happens mid-candle does not count.
- Check that the line slopes away from zero over the next one to three candles instead of flattening out.
- Check that price agrees. For a bullish cross, price should be above a recent swing high or a longer moving average. For a bearish cross, it should be below a recent swing low or that average.
- The higher timeframe's MACD line is on the same side of zero.
Strong vs weak zero-line crosses
A strong cross comes from well below (or above) zero and keeps going after it crosses. Price makes a new swing in the same direction. That pattern tells you the short average is pulling away from the long one, not just touching it.
A weak or broken cross hugs zero. The line flips back and forth inside a few candles while price moves sideways. A cross caused by one news spike that is fully retraced on the next candle is also broken. So is one that goes against the higher timeframe (step 6 of the checklist). Treat it as noise, even when it closes on the right side.
The chart below shows both cases. Early on, price moves sideways and the line keeps flipping around zero. Then price dips and the line drops deep below zero. Price turns up a few candles before the line crosses, and it breaks above the earlier highs as the line crosses and keeps climbing. That gap between the turn in price and the cross is the lag you pay for confirmation.
How often the MACD zero line gets crossed
The IndicatorFree Lab counted MACD crosses on 12 months of broker demo data, from 2025-10-30 to 2026-10-30. These are past data, not a forecast.
| Market | Timeframe | 12/26/9 signal-line crosses per month | 12/26/9 zero-line crosses per month | 5/35/5 zero-line crosses per month |
|---|---|---|---|---|
| EURUSD | 1-hour | 42.9 | 18.8 | 25.1 |
| EURUSD | 4-hour | 10.8 | 4.6 | 5.9 |
| XAUUSD | 1-hour | 41.2 | 16.3 | 22.4 |
| XAUUSD | 4-hour | 10.9 | 4.5 | 5.2 |
The 5/35/5 setting (a faster short average) produced more zero-line crosses on every market, which means more signals and more noise.
Two practical readings follow from this. First, on the 1-hour chart with 12/26/9, signal-line crosses came about 2.3 times as often as zero-line crosses (42.9 ÷ 18.8). So the zero line is a much slower, quieter filter. Second, on the 4-hour chart there were about 4-5 zero crosses a month, roughly one a week.
Two zero-line setups with entry, stop and target
Setup 1: Trend-filtered zero-line cross
- Entry: buy at the close of the candle where the MACD line closes above zero (a bullish cross), when steps 3-6 of the checklist are met. The cross only becomes an entry when the checklist filters agree; on its own it just sets direction. For a sell, use the bearish cross, where the line closes below zero, and reverse every rule.
- Stop loss: below the last swing low before the cross. That low is the point where the new upswing is proven wrong.
- Target: twice the stop distance, or the next clear resistance level if that comes first.
Setup 2: Zero-line hold in an existing trend
- Entry: in an uptrend, wait for the MACD line to pull back during a price pullback and come close to zero (within about a fifth of its recent peak) without closing below it. Buy when it turns up and the candle closes higher.
- Stop loss: below the pullback low.
- Target: the prior swing high first. Move your stop to breakeven there if you hold for more.
The drawing below shows the shape to look for: price pulls back, the MACD line sinks toward zero but stays above it, and the buy comes when the line turns up again.
Sizing either setup: worked example
The figures here are an illustrative example. Your account is $5,000 and you risk 1% per trade. You take a Setup 1 trade on EURUSD. The stop sits 30 pips below the entry, and the target sits 60 pips above it, twice the stop distance. A standard lot (100,000 units) on a USD-quoted pair is worth $10 per pip.
If the stop is hit, you lose $48 (30 × 0.16 × $10). That is just under your $50 limit because the size was rounded down. If the 60-pip target (twice the stop) is reached, you make $96, or about $100. Work out the size from the stop distance every time, so that a wider stop means a smaller position.
When zero-line signals work and when to skip them
The rules below are general guidelines, not something the Lab measured. If price has just closed outside a range and the cross agrees with the higher timeframe (step 6 of the checklist), the cross is worth taking. If price is still inside the range, skip it. Also skip crosses in the minutes before major news, and when the line keeps flipping around zero.
Tie that range alarm to the timeframe. On the 4-hour chart, more than two crosses in one week (normal is about one) means a range. On the 1-hour chart, more than two crosses in one day means a range; normal is a little under one a day, based on the 1-hour zero-line rates in the table above. Stand aside until the line pulls clear of zero.
FAQ
Should I exit a trade when MACD crosses back through zero?
Treat it as a warning, not an automatic exit. If the line closes back on the other side of zero and price also breaks the swing that confirmed your entry, the trade idea is broken and closing early is reasonable. If the line only dips across zero while price holds its structure, keep your original stop.
Do zero-line crosses behave the same on gold?
Yes, at a similar rate (see the table). The difference is stop size: gold usually moves more per candle than EURUSD, so swing-based stops are wider in price terms. Reduce your position size to keep the same risk in money.