









CCI
Also called Commodity Channel Index, CCI indicator, CCI oscillator
The CCI (Commodity Channel Index) is a momentum oscillator that measures how far price has moved from its recent average. It is scaled so most readings sit between +100 and −100, and readings beyond those lines flag an unusually strong move.
Despite the word "Commodity" in its name, CCI only needs a high, low and close, so it works the same way on forex pairs, stocks, indices and gold. It also has no ceiling and no floor. A reading above +100 can be the start of a trend, and selling every reading above +100 means fighting the trend at its strongest point.
How the CCI formula turns price into a number
CCI compares the current typical price (the average of a candle's high, low and close) with its own moving average. It then divides that gap by how far price normally wanders around the average.
Typical price (TP) = (High + Low + Close) / 3
CCI = (TP − SMA of TP) / (1.5% × Mean deviation)
The mean deviation is the average distance of each typical price from the moving average over the period. The 1.5% constant is a scaling choice that keeps most readings inside ±100. Dividing by 1.5% is the same as multiplying by 200 and dividing by 3. So +100 means price is 1.5 times its normal wander above its average, and +200 means three times.
The example below is illustrative, with round numbers. The typical price sits 30 pips above its 14-period average, and the mean deviation is 20 pips.
MT5 default settings for CCI are a period of 14, applied to Typical price. That matches the textbook formula above.
Reading CCI: the zero line, ±100 and beyond
- Above 0: price is above its average, so buyers have the edge.
- Above +100: an unusually strong move up. In a range it warns that price is stretched. In a trend it confirms strength.
- Below −100: the same thing on the downside.
- A move back inside ±100: this is the signal most traders act on. It shows the extreme push has paused.
The common misread is treating +100 as a hard overbought line. Here is a rule for telling the two cases apart:
- If CCI keeps returning above +100 and only pulls back to about zero, you are in a trend. Trade pullbacks in the trend's direction.
- If CCI swings from +100 to −100 and back, you are in a range. Trade the moves back inside ±100.
The chart below shows both cases in one sequence, with illustrative price candles above the CCI line. CCI dips below −100 and climbs back (the range-style signal). Then it pushes above +100 and stays there for about eight candles while the trend runs.
When CCI helps and when to switch it off
Where it works well:
- Ranges, where the ±100 cross-back signal works best.
- 1-hour to daily charts, where each candle moves enough to measure. On 5- or 15-minute charts, use ±200 and expect more noise.
- Quiet periods after the day's main news has passed.
When to avoid it or trade smaller:
- The minutes around major releases such as rate decisions or jobs data. A single candle can throw CCI far past ±100, and that reading tells you nothing.
- Very short charts such as the 1-minute, where spread and random noise make up most of each candle's move, so the readings jump around.
- Strong one-way trends, if reversal signals are the only ones you trade.
CCI strengths and weaknesses at a glance
| Pros | Cons |
|---|---|
| Works on any market with a high, low and close | No fixed limits, so "extreme" is relative |
| The zero line gives a simple trend bias | Many false ±100 signals in strong trends |
| Reacts quickly to new momentum | Lags at turning points on longer periods |
| Divergence is easy to see at extremes | You need a separate price level for your stop |
A CCI setup on a real EURUSD chart
Buying the climb back above −100 (EURUSD 1-hour)
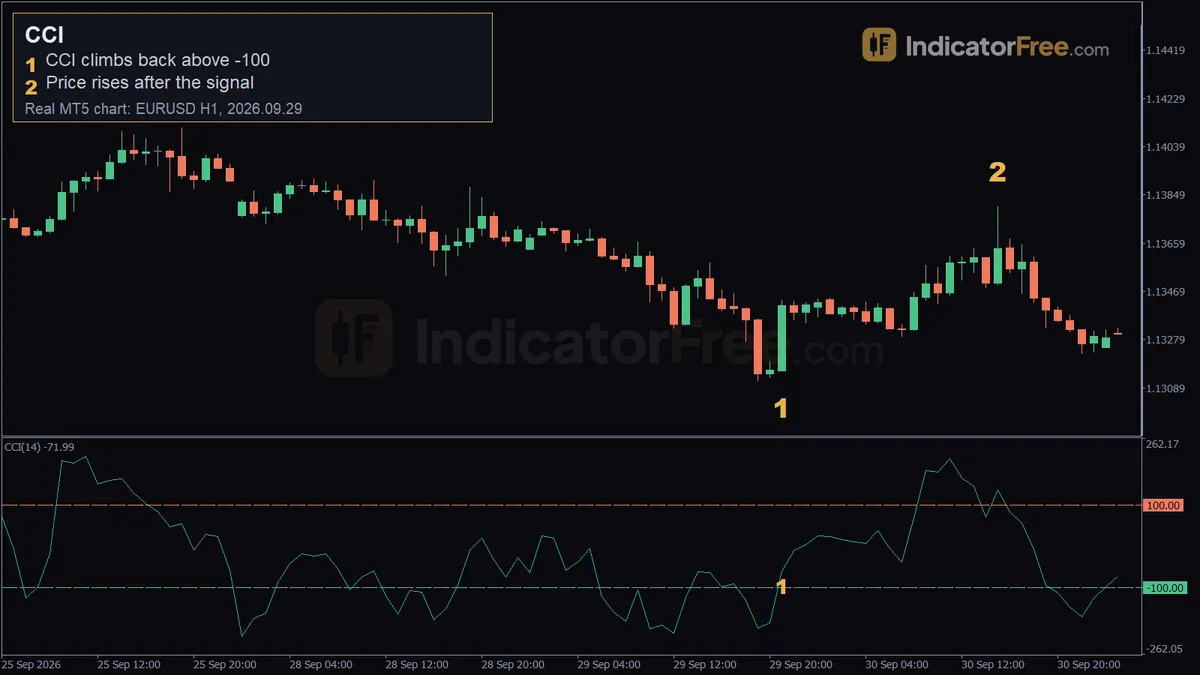
The chart at the top of this page is a past example, not a prediction. On the 1-hour EURUSD chart, CCI (14) dipped below −100 into oversold territory. On 2026.09.29 at 21:00 it climbed back above −100, with price at 1.13157 (marker 1).
- Entry trigger: the close of the candle where CCI crosses back above −100, here around 1.13157. Waiting for the close keeps you out of crosses that vanish before the candle ends.
- Stop loss: a few pips below the lowest low of the oversold dip. In this trade, that is the lowest candle of the dip in the chart at the top of this page. If it is too far away for your position size, skip the trade.
- Exit: take profit when CCI rises above +100 and then turns back below it, or at a fixed multiple of your risk. Marker 2 (1.13803, 2026.09.30 15:00) shows the high, not your exit. Where you would have got out depends on which exit rule you picked. By the end of the 20 candles some of that gain had faded, leaving a net rise of 39 pips.
Prefer crosses that come up from a clear dip well below −100, not readings that hover around the line.
Choosing a CCI period for your trading style
| Style | Chart | Period | Levels to watch |
|---|---|---|---|
| Scalping | 5- or 15-minute | 14–20 | ±200 for extremes, because ±100 triggers too often |
| Day trading | 1-hour | 14 | ±100 for signals, 0 for trend bias |
| Swing trading | 4-hour or daily | 14–20 | ±100, plus divergence at extremes |
A shorter period reacts faster but gives more false signals. A longer one smooths the line but lags more.
Gold vs major FX pairs: if CCI on your chart keeps reaching ±200, as it can on spikier markets such as gold, treat ±200 as your extreme or lengthen the period. Keep ±100 on calmer pairs such as EURUSD.
Practical tips for trading CCI
- Check CCI's zero line on the next higher timeframe. When it is above zero, take only buys.
- Watch for divergence at extremes: price makes a new low while CCI makes a higher low below −100.
- Spot a failed cross early: if CCI slips back below −100 within a candle or two of your entry, the push has not paused. Exit rather than wait for the stop.
- Only compare values that use the same period and price source. CCI on close prices gives different numbers from CCI on typical price.
Quick checklist before a CCI trade:
- Is the market ranging or trending, judging by how CCI behaves around ±100?
- Did CCI cross back inside ±100 on a closed candle?
- Is there a clear swing high or low for the stop?
- Is major news due while the trade will be open?
FAQ
Why does CCI jump at the stock market open?
Stocks often gap overnight, so the first candle of the session can open far from the prior close. That gap pushes the typical price away from its average in one step, and CCI spikes. Read the first candle of the session with care.
Why does my daily CCI differ from another trader's?
Your charts may close the daily candle at different times. A different candle timezone gives each day a different high, low and close, which changes every typical price and every CCI reading.