









Momentum indicator
Also called Momentum oscillator, MOM
The Momentum indicator is a single-line oscillator (a line that swings around a centre value, here 100). It compares the latest close with the close a set number of candles ago, showing whether price is still pushing ahead or running out of steam.
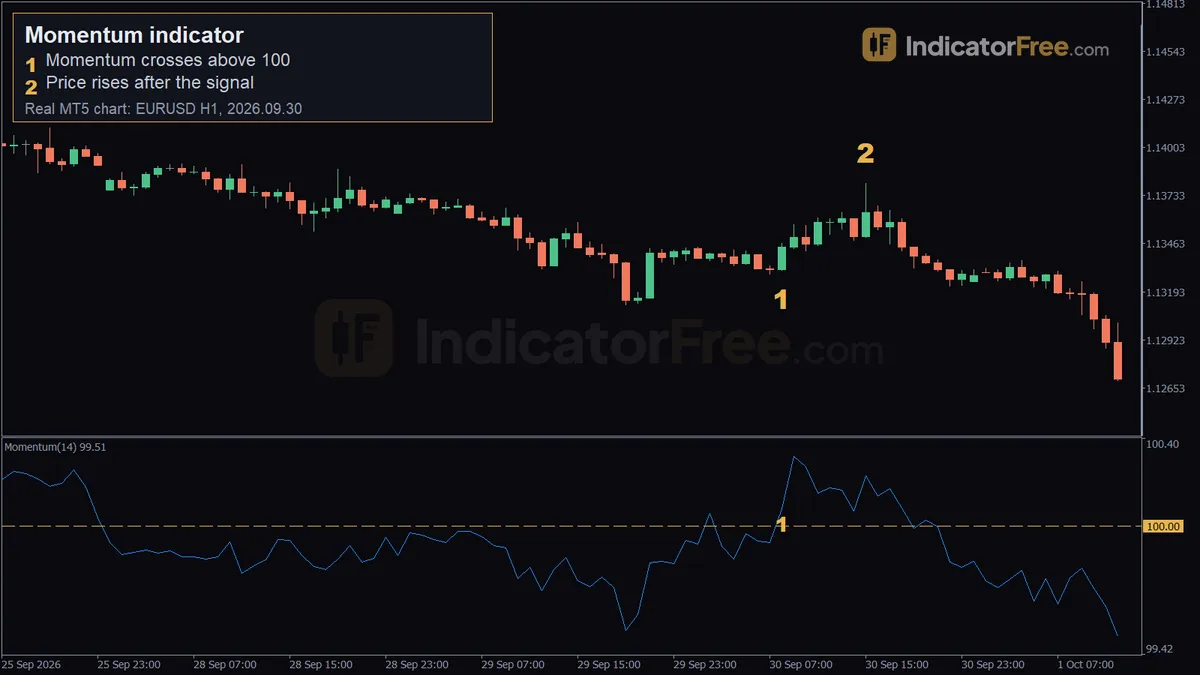
In the chart further down, Momentum peaks six candles before price does. Read correctly, it can stop you from buying a move that has already lost its push. It can also warn you to protect profit on a trade that is still showing a gain.
The Momentum formula: today's close against an older close
Momentum = (Close now ÷ Close n candles ago) × 100
The number n is the lookback period: how many candles back the indicator looks. A reading above 100 means price is higher than it was n candles ago. Below 100 means it is lower. Exactly 100 means there was no net change.
The distance from 100 is the size of that change in percent. A reading of 101 means price is 1% above the older close. The illustrative calculation below uses round numbers so you can check it yourself.
Default settings in MT5: period 14, applied to Close, plotted as a ratio around 100.
Some charts plot the difference instead (close now minus close n candles ago), so the line sits around 0 but reads the same way; that version is in price units, not percent.
Reading the Momentum line: level, slope and the 100 cross
- Above 100 and rising: the gain over the last n candles is growing.
- Above 100 but falling: price is still higher than n candles ago, but that gap is shrinking, either because price slipped or because the old reference candle was higher. A falling line is not always a slowing move, as the news trap further down shows.
- Crossing 100: price has moved from below the older close to above it, or the other way round. This is the usual entry trigger.
- Divergence: price makes a higher high but Momentum makes a lower peak, a sign the push is fading.
The most common misread is treating a falling line as a falling price. In the chart below, Momentum peaks at the first price high. Price then pushes to a higher high six candles later, but Momentum makes a lower peak. The line only crosses below 100 after price has rolled over.
A simple rule follows from this. If Momentum is above 100 but has made a lower peak, don't open new buys. Move your stop closer instead.
Momentum has no fixed overbought or oversold level, because the line has no ceiling. Don't judge a reading against a set number like 102. Compare it with the extremes that the same instrument reached in recent weeks.
When Momentum signals help and when to switch them off
Works well:
- after price breaks out of a range and starts to trend;
- on 1-hour charts and slower, where single candles add less noise (shorter charts need a shorter period and give more false crosses);
- as a second check that confirms a breakout or a pullback entry.
Avoid:
- tight sideways ranges, where the line keeps crossing back and forth over 100;
- the minutes around high-impact news, when one spike candle throws the reading out;
- 1-minute charts, where random noise in single closes moves the line more than real buying or selling does.
News leaves a second trap. The spike candle stays in the calculation. When it drops out of the lookback window n candles later, the line can jump even if price is quiet at that moment. The line moves because the close it compares against changed, not because of new buying or selling. Ignore any cross that happens exactly n candles after a big news bar.
Momentum indicator pros and cons
| Pros | Cons |
|---|---|
| Simple formula you can check by hand | Uses only two prices and ignores everything in between |
| Shows trend strength as a percent you can compare across days | Early warnings often come too early in strong trends |
| Same formula works on any market and timeframe | No fixed overbought or oversold levels, so you must compare with recent extremes |
| The 100 cross gives a clear, rule-based trigger | Old candles leaving the window can cause false crosses |
Trading the Momentum cross above 100: EURUSD 1-hour example
The chart at the top of this page is a past example, not a prediction. On 2026.09.30 at 08:00, Momentum (14) closed above 100 on the 1-hour EURUSD chart. That candle closed at 1.13446, higher than the close 14 candles earlier. The marker on the chart sits at that candle's low, 1.13315; your fill is the close, 1.13446.
- Entry trigger: the candle closes with Momentum above 100. Buy at the close, 1.13446, or at the next open.
- Stop loss: below the most recent swing low before the cross. Here that is the 07:00 low at 1.13291, about 15.5 pips of risk.
- Exit: sell part of the position when Momentum makes a lower peak while price is still rising. Close the rest when Momentum drops back below 100, because the reason for the trade is gone.
The 15:00 candle spiked to 1.13803, about 36 pips above the entry, but it closed at 1.13637, about 19 pips above it. Price did not hold there. The 22:00 low of 1.13224 went through the 1.13291 stop, and by the next morning price was still below the entry: the 03:00 candle on 2026.10.01 closed at 1.13332, about 11 pips under it.
This is where the exit rule earns its place. Working from the closes above, the first lower peak came at 12:00. Momentum (14) was about 100.27 at 10:00, then peaked lower at about 100.17 at 12:00 while price closed higher at 1.13583. The rule sells half there, about 14 pips above the entry. Momentum (14) first closed below 100 at 19:00, measured against the 05:00 close fourteen candles earlier: 1.13394 ÷ 1.13403 × 100 ≈ 99.99. The rule closes the rest there, about 5 pips below the entry and three candles before the stop is hit. Half at about +14 pips and half at about -5 pips gives (13.7 − 5.2) ÷ 2 ≈ +4 pips across the whole position. This is one past case. Plenty of crosses above 100 fail inside ranges.
Choosing the Momentum period for your trading style
The periods below are common starting points, not tested values.
| Style | Chart | Period | What you get |
|---|---|---|---|
| Scalping | 5- and 15-minute | 9–10 | Fast turns, more false crosses; use only with a higher-timeframe filter |
| Day trading | 1-hour | 14 | A balance of speed and noise |
| Swing trading | 4-hour and daily | 14–21 | Fewer, slower signals that follow bigger swings |
Gold moves by bigger percentages than major FX pairs like EURUSD. Its Momentum line swings much further from 100, so never reuse the distance thresholds from one market on the other.
Momentum trade checklist before you enter
- Is the higher-timeframe trend on my side? Take buy crosses only when the trend on the next timeframe up is rising.
- Did the 100 cross happen on a closed candle, away from news?
- Is price trending, not stuck in a range?
- Is my stop below the last swing low, set from price structure rather than the Momentum line, and sized to my risk?
- If Momentum makes a lower peak, will I treat it as a cue to manage the trade, not as a signal to reverse?
FAQ
Which momentum indicator is best for trading?
No single one is best. Momentum and Rate of Change show raw speed. RSI and Stochastic squeeze that speed into a 0–100 scale with overbought and oversold levels. Pick one, learn how it behaves on your market, and don't stack several that measure the same thing.
Does the Momentum indicator repaint?
Once a candle closes, its Momentum value is fixed. The reading on the live candle changes until that candle closes, so a cross can appear and then vanish within the bar.
How is Momentum different from Rate of Change?
Rate of Change is Momentum minus 100. It shows the same percent change, but it is plotted around 0 instead of 100. A Momentum reading of 101 is a Rate of Change of 1.