









Risk Per Trade: How Much to Risk and How to Calculate It
Risk per trade is the money you lose if a trade hits its stop loss. It is usually set as a fixed percentage of your account. A widely taught guideline is about 1%, and 0.5% to 2% is the common range. To work it out, multiply your account by your risk percentage. Then divide that money by your stop distance in pips times the pip value per lot.
This one number decides how much a single loss hurts. Keep it small and a bad week is a dent you can recover from. Make it large and an ordinary run of losses can take most of the account before you react.
What risk per trade actually measures
Risk per trade is not your lot size, and it is not your margin. It is the loss you agree to before you enter: the distance from entry to stop loss, multiplied by the size of your position.
So two things control it. The stop distance comes from the chart, at the point where your trade idea is proven wrong. The position size is the dial you turn so that this distance costs exactly the money you planned to lose.
Most traders set it as a percentage of account equity, which is your balance plus or minus any open profit or loss. A percentage moves with your account. The money at risk shrinks after losses and grows after wins. This method is called fixed-fractional sizing.
The picture below shows the key idea. Both trades risk the same $100 on an illustrative account. The trade with the wider stop just gets a smaller position.
The risk per trade formula in three steps
- Money at risk = account equity × risk %.
- Risk per lot = stop distance in pips × pip value per lot.
- Lot size = money at risk ÷ risk per lot.
Step 2 needs the pip value, which is what one pip is worth for one lot. For pairs quoted in US dollars, such as EUR/USD, one pip is worth roughly $10 on a standard lot (100,000 units), $1 on a mini lot (10,000 units) and $0.10 on a micro lot (1,000 units). Other pairs and accounts in other currencies, such as a pound account, have different pip values. Look the value up instead of assuming $10.
The same logic works in every market. Futures, stocks and gold all start from the gap between entry and stop, turned into money for the size you trade. Only the value of each point changes. The same number of futures contracts can carry very different money risk from one market to another.
Worked example: risking 1% on a $10,000 account
The figures here are an illustrative example. Say you have a $10,000 account in US dollars and risk 1% per trade. You want to buy EUR/USD at 1.1000 with a stop at 1.0975 and a target at 1.1050.
The stop distance is 1.1000 − 1.0975 = 0.0025, or 25 pips. The target is 1.1050 − 1.1000 = 0.0050, or 50 pips. So the trade risks 1 to make 2.
Now run the three steps. The last line checks the answer.
You would place 0.40 lots, which is 4 mini lots. If price falls to 1.0975, you lose 25 × $10 × 0.40 = $100, or 1% of the account. If it reaches 1.1050, you make 50 × $10 × 0.40 = $200 before costs.
Set the stop first, then the size: a real gold example
The order matters. First find the stop on the chart, at a level such as just past a recent low. Only then work out the size. Traders who pick a size first and squeeze the stop to fit it end up with stops at levels the market reaches all the time.
Take a past trade on a 1-hour gold (XAUUSD) chart, used as an example and not a prediction. The trade's levels are entry 4119.95, stop loss 4091.11 and take profit 4177.63. All the maths below uses those three prices. The chart below marks the entry (1), the stop under the recent low (2) and the target at 2R (3).
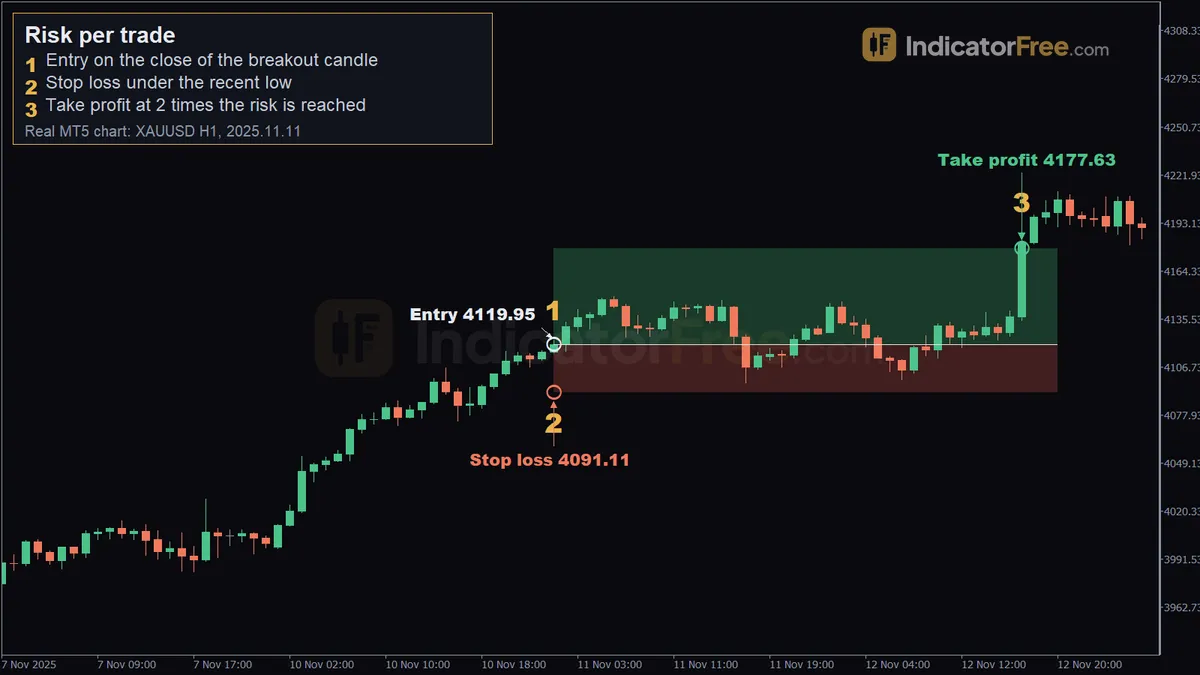 Real XAUUSD H1 chart from MetaTrader 5, a past example, not a forecast. 1 - entry on the close of the breakout candle; 2 - stop loss under the recent low; 3 - take profit at 2 times the risk is reached.
In the chart above, marker 1 sits on the close of the breakout candle at 01:00 on 2025.11.11 and is drawn at 4122.81. The trade's entry level is 4119.95. Marker 2 is the stop under the recent low at 4091.11, on the same 01:00 candle. The risk is 4119.95 − 4091.11 = 28.84. Marker 3 is drawn at 4185.61 on the 17:00 candle of 2025.11.12, the candle where price reached the take profit. The target itself was 4177.63, which is 4119.95 + 57.68, twice the 28.84 risk. The marker prices only show where each label sits on the chart. To redo the maths, use the three trade levels.
The formula does not change for gold: lots = money at risk ÷ (28.84 × the money value of a 1.00 move in gold for one lot). That value depends on the contract your broker offers, so check it with your broker before you size. For illustration, suppose a 1.00 move is worth $100 per lot. On the same illustrative $10,000 account at 1%, that gives $100 ÷ (28.84 × $100) = 0.0347, rounded down to 0.03 lots. Because of the rounding, the loss at the stop is $86.52 and the gain at the target is $173.04, both under the planned $100 and $200.
Risk per trade table: lot sizes for different accounts and stops
Every row is illustrative. All rows assume a USD account trading a USD-quoted pair such as EUR/USD, so one standard lot is worth about $10 per pip. The last column always rounds down, so you never risk more than you planned.
| Account | Risk % | Money at risk | Stop | Exact lots | Lots to use |
|---|---|---|---|---|---|
| $1,000 | 1% | $10 | 20 pips | 0.05 | 0.05 |
| $1,000 | 0.5% | $5 | 30 pips | 0.0167 | 0.01 (risks $3) |
| $1,000 | 1% | $10 | 150 pips | 0.0067 | Below 0.01: skip or rethink |
| $5,000 | 0.5% | $25 | 25 pips | 0.10 | 0.10 |
| $10,000 | 1% | $100 | 25 pips | 0.40 | 0.40 |
| $10,000 | 1% | $100 | 50 pips | 0.20 | 0.20 |
| $10,000 | 2% | $200 | 40 pips | 0.50 | 0.50 |
The table gives you two rules for small accounts. First, always round down. Rounding 0.0167 up to 0.02 would risk $6 instead of the planned $5.
Second, if the exact size is below the smallest lot your account allows, the trade is too big for your account at your risk level. Say the smallest size is 0.01 lots, a micro lot. With a 150-pip stop, 0.01 lots risks $15, which is 1.5% of a $1,000 account. You have three choices: accept the higher percentage knowingly, find a setup with a tighter stop that still makes sense on the chart, or skip the trade. Never tighten the stop just to make the numbers fit.
What 10 losses in a row do at 1%, 2%, 5%, 10% and 20% risk
Even a sound method has losing streaks, so the useful question is what a run of losses costs you. Suppose you lose 10 trades in a row and work out your risk from your new equity after each loss. What is left is (1 − risk %) to the power of 10.
At 1%, ten losses leave about 90.4% of the account, so you are down roughly 10% and most of your capital is still there. At 20%, the same streak leaves about 10.7%.
Some traders argue that if you recalculate after every loss, the account can never reach zero. Mathematically that is true, but it helps very little. The real question is what it takes to get back to where you started:
| Risk per trade | Left after 10 losses | Gain needed to get back to start |
|---|---|---|
| 1% | 90.4% | +10.6% |
| 2% | 81.7% | +22.4% |
| 5% | 59.9% | +67.0% |
| 10% | 34.9% | +186.8% |
| 20% | 10.7% | +831.3% |
The gain you need is 1 ÷ (what is left) − 1. As risk per trade goes up, the gain needed to recover grows much faster than the loss itself. The chance of falling to a level you cannot come back from is called risk of ruin. On a small account, the minimum lot also stops you from shrinking positions past a certain point. In practice, that breaks the idea that you can never reach zero.
How much to risk per trade: rules for choosing your percentage
A 1% allowance is a common, conservative starting point for newer traders, which you adjust later to your own tolerance. Use these rules to pick your number within the 0.5% to 2% range:
- If 10 losses in a row at your chosen % would make you break your plan or chase losses, it is too high. The right number is one you can lose again and again and still trade calmly.
- If the method is new or untested, start at the low end. You do not yet know how long its normal losing streaks are.
- If you hold several trades at once, cap the total as well as each trade. Three open trades at 1% each can mean up to 3% at risk together.
- Never raise your risk to hit an income goal. The goal does not change the odds of your next trade.
Is 1.5% acceptable? It sits inside the commonly taught range. Run it through the same streak test: 10 losses at 1.5% leave about 86.0% of the account (0.985 to the power of 10). If you can live with that, it fits.
Expectancy: what risk per trade can and cannot change
This section is pure arithmetic, not a claim about any strategy. Measure each result in R, where 1R is the amount you risk on a trade. Take a setup with a 1:2 risk-reward ratio and call its win rate W, the share of trades that win, written as a decimal.
Expectancy = (W × 2R) − ((1 − W) × 1R) = (3W − 1)R per trade.
Spreads and commissions are paid on winners and losers alike, so they cut into every R you earn.
Expectancy is zero when 3W − 1 = 0. So the break-even win rate for a 1:2 trade is 1 ÷ (1 + 2) = 33.3%. If you win less often than that, a 1:2 setup loses money over time, however you size it.
Risk per trade cannot turn a losing method into a winning one. It only scales the results. A higher percentage makes a good method's gains and drawdowns bigger, and makes a bad method lose money faster.
Risk per trade mistakes that blow accounts
- Choosing lots first. If you always trade 1 lot, your risk changes with every stop distance. At $10 per pip, 1 lot risks $200 with a 20-pip stop and $800 with an 80-pip stop.
- Confusing margin with risk. Leverage and margin decide how big a position you can open, not how much you can lose. Your risk comes from size and stop distance. Using little margin does not mean taking little risk.
- Widening the stop after entry. If you move the stop from 25 to 50 pips without cutting size, you double the risk on a trade you already sized.
- Stacking correlated trades. Several pairs that move together are one idea, not several. This is correlation risk, and the figure after this list shows how it hides.
- Treating the stop as a guaranteed price. Price gaps, fast news moves and slippage can fill your stop past its level, so the real loss can be bigger than planned. The spread counts too. Size slightly smaller to leave a buffer, and keep the stop.
- Using $10 per pip on every pair. That figure only fits USD-quoted pairs on a USD account. Use the real pip value for your pair and your account currency.
- Ignoring the day as a whole. A daily loss limit, such as stopping after a set number of losses or a set percentage down, keeps one emotional session from wiping out weeks of careful risk.
A one-minute routine before every order
Before any trade, you need two numbers: your stop level and your current equity. The size depends on both. Once it becomes a habit, the routine below takes about a minute.
- 1Mark the stopWhere the idea is wrong on the chart
- 2Measure the distanceEntry to stop in pips, plus the spread
- 3Read your equityUse equity if trades are open
- 4Money at riskEquity × risk %
- 5Size and round downMoney ÷ (pips × pip value)
- 6Check total open riskAdd up risk on all open trades
FAQ
Should I calculate risk per trade from my balance or my equity?
With no trades open, the two are the same. With trades open, use equity, or your balance minus the risk already on open trades. That way a floating profit cannot make you size too big, and a floating loss is already counted.
Should I lower my risk after a losing streak?
Percentage sizing already lowers the money at risk as equity falls. Many traders add a drawdown rule on top. For example, they halve the percentage once the account is down a set amount and go back to normal after it recovers. Decide the rule in advance, not in the middle of a streak.
Can I risk more on the setups I trust most?
You can, but set a hard maximum and write the tiers down before you trade. For example, 0.5% on normal setups and never more than 1% on your best. If you raise size because a trade feels good in the moment, you are sizing on emotion, not on the setup.
Should I skip the stop loss if the market keeps hitting it?
No. Without a stop, your risk per trade is undefined, and one move can cost far more than you planned. If your stops are hit too often, place them beyond the level where the idea is truly wrong. Then reduce your size so the money at risk stays the same. That is exactly what the formula is for.
Do I include the spread in my stop distance?
Yes. A buy fills at the ask but its stop triggers on the bid, and a sell works the other way round. In both cases your fill and your stop sit on opposite sides of the spread. Add the spread to the pips you measured on the chart before you size, so the loss at the stop matches the money you planned to risk.
How do I calculate risk per trade on USD/JPY or with a GBP account?
Use the same formula and change only the pip value. On USD/JPY a pip is 0.01, so one standard lot moves 100,000 × 0.01 = 1,000 yen per pip. To turn that into dollars, divide by the price. Say USD/JPY is at 150.00: 1,000 ÷ 150 = about $6.67 per pip, not $10.
With a pound account, convert the pip value into pounds. Say GBP/USD is at 1.2500: a EUR/USD standard lot is worth $10 ÷ 1.25 = £8 per pip. Risking 1% of £10,000 is £100, and a 25-pip stop costs 25 × £8 = £200 per lot, so you trade £100 ÷ £200 = 0.50 lots.
Part of Risk & money management: more guides, terms and free tools on this subject.