









Win rate
Also called win ratio, success rate, success ratio, hit rate, winning percentage, strike rate
Win rate is the share of your closed trades that ended in profit: winning trades divided by total trades, times 100. On its own it does not show whether a strategy makes money, because it ignores how big the wins and losses are.
A high win rate feels safe, and that is exactly why it misleads. You can win nine trades out of ten and still lose money if the one loss is bigger than the nine wins put together.
How to calculate win rate from your trade history
The formula is short: win rate = winning trades ÷ total closed trades × 100. Traders also call it win ratio, success rate or hit rate; the calculation is the same.
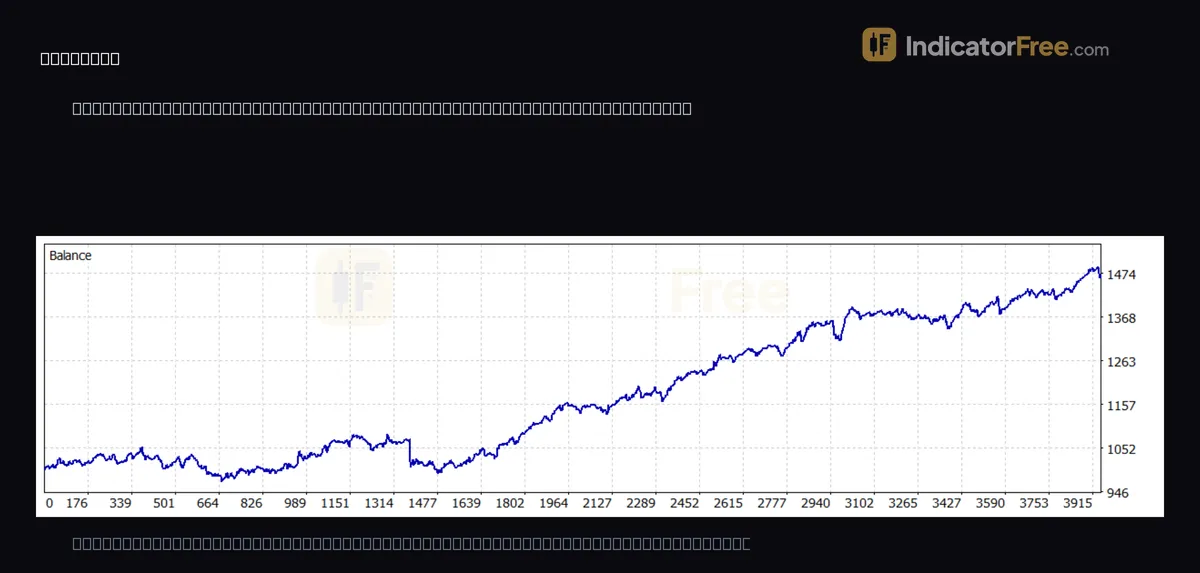
Here is a past example, not a prediction. A backtest of an automated trading strategy on gold (XAUUSD), 1-minute chart, from 27 July to 27 September 2026, closed 1,966 trades. Of those, 1,173 ended in profit. 1,173 ÷ 1,966 × 100 = 59.66%.
Count a trade as a win only after costs. A trade that closes at your entry price is a small loss once spread and commission are paid. Pick one rule for these trades and keep it, or your win rate will not be comparable from month to month.
Why a high win rate can still lose money: three strategies compared
The figures in this section are an illustrative example. Three strategies each take 100 trades, and each loses $100 on an average losing trade.
| Strategy | Win rate | Average win | Money won | Money lost | Net result |
|---|---|---|---|---|---|
| A | 90% | $10 | 90 × $10 = $900 | 10 × $100 = $1,000 | −$100 |
| B | 70% | $50 | 70 × $50 = $3,500 | 30 × $100 = $3,000 | +$500 |
| C | 40% | $200 | 40 × $200 = $8,000 | 60 × $100 = $6,000 | +$2,000 |
The strategy with the highest win rate is the only one that loses. Strategy C loses more often than it wins and still ends with the most money, because each win is twice the size of each loss.
The average result per trade is called expectancy: expectancy = (win rate × average win) − (loss rate × average loss), where the loss rate is 100% minus the win rate. The calculation below applies the formula to strategy C. To use it yourself, put in your own numbers.
The gold backtest's expected payoff was 0.24 per trade: positive, but thin across 1,966 trades.
What counts as a good win rate: the breakeven line
A good win rate is one that sits above your breakeven win rate. There is no single best number, because the breakeven point moves with the size of your wins.
Breakeven win rate = 1 ÷ (1 + average win ÷ average loss). If your average win equals your average loss, the ratio is 1 and you need 1 ÷ 2 = 50%. If wins are twice the losses, you need 1 ÷ 3 = 33.3%. If wins are half the losses, you need 1 ÷ 1.5 = 66.7%.
The chart below draws that line. Find your reward-to-risk on the bottom axis, then check whether your real win rate is above or below the curve.
Use it as a decision rule. If your win rate after costs is above the line, the strategy has positive expectancy. If it is below, a smaller lot size only slows the loss; you have to change the stop, the target or the entry.
The gold backtest shows how thin the margin can be. Its profit factor (total money won ÷ total money lost) was 1.18 with 59.66% winners and 793 losers. That means the average win was about 1.18 × 793 ÷ 1,173 ≈ 0.80 of the average loss. Breakeven for 0.80 is 1 ÷ 1.80 ≈ 55.6%, so the test cleared the line by about four points. This is past data, not a forecast.
How to find your win rate in your own results
You do not set a win rate; it is a result. Take it from your own closed trades, whether you keep them in a trading journal, export them from your account history or get them from a backtest. Then read it next to the path your balance took.
The equity curve below uses strategy A from the illustrative table above: a $1,000 account, nine wins of $10, then one loss of $100. Nine trades out of ten win, yet the balance ends below where it started.
Split your trades into buys and sells, and work out a win rate for each group. A strategy can win often on buys and rarely on sells, and the combined figure hides it.
What you do control are the stop loss and take profit, and they move the win rate. Pull the target closer and you win more often, but each win shrinks. Always re-check the average win after such a change.
Checks before you trust a win rate
- Read it with two other numbers. Average win and average loss sit in the same report. Without them, win rate tells you nothing about profit.
- Confirm costs are inside. Spread, commission and swap turn small wins into losses. A win rate measured without them is too high.
- Look for open losers. A trade that is never closed is never counted as a loss. A high win rate beside a deep equity drawdown is the warning sign.
- Match the market and timeframe. A win rate from one symbol on the 1-minute chart does not transfer to another symbol or to the daily chart.
- Plan for losing streaks. With a 50% win rate, the chance that your next five trades all lose is 0.5 × 0.5 × 0.5 × 0.5 × 0.5 ≈ 3%. Over hundreds of trades that streak will arrive, so size each trade to survive it.
- Compare live with test. If your live win rate falls below your breakeven line, stop and review before the next trade.
FAQ
What is the average win rate in trading?
There is no one figure that fits all traders, because the number depends on style. By the breakeven rule above, a strategy whose average win is three times its average loss (a 1:3 reward-to-risk) only needs to win 25% of the time, so it can lose most of its trades and still make money. Strategies that take small, quick profits win often and rely on keeping losses small.
How many trades do I need before a win rate means anything?
The more, the steadier. With 30 trades, one extra win or loss moves your win rate by about 3.3 points. With 300 trades, it moves it by about 0.33 points. A win rate from a few dozen trades can sit on the wrong side of your breakeven line by luck alone.
Why do strategies with a very high win rate blow accounts?
Many reach that number by avoiding losses on paper: no stop loss, adding to losing positions, or doubling the size after each loss. Wins stay small and frequent, while one move against the open positions can take back all of them. The highest win rate is not the goal; the highest expectancy you can hold through a losing streak is.