









Average win
Also called Average winning trade, Average profit trade, Avg win, Average profit per winning trade
Average win is the mean profit of your winning trades: the total profit from all winners divided by the number of winners. It shows what a typical winning trade adds to your account, in money, pips or multiples of risk.
On its own the number says little. Put it next to your average loss and it tells you how often you must win just to stop losing money.
The average win formula
Average win = Gross profit of winning trades ÷ Number of winning trades
Only trades closed in profit go in. Losing trades and breakeven trades are left out of both the top and the bottom of the division.
You can express the result three ways: in money, in pips, or in R, where 1R is the amount you risked on that trade. A trade that risked $50 and made $100 is a 2R win.
Average win worked out on 500, 5,000 and 50,000 USD accounts
The figures here are an illustrative example. Each account risks 1% per trade and takes ten trades. Five of them win, at 1R, 2R, 1.5R, 2.5R and 1R. The other five each lose 1R.
Start with the $500 account. The steps are in the calculation below.
On the $5,000 account, where 1R is $50, every money figure is ten times larger: $400 of gross profit and an $80 average win. On the $50,000 account it is a hundred times larger: $4,000 and $800. The result is still 1.6R, or 1.6% of the account, in all three cases.
The averages of $8, $80 and $800 describe exactly the same trading. Only the R figure, or the percentage of the account, lets you compare them.
How many winners your average win needs to break even
Many traders ask what share of winning trades is good. There is no single figure, because the answer depends on your average win and average loss.
Breakeven share of winners = Average loss ÷ (Average win + Average loss)
On the $500 account the average loss is $5 and the average win is $8. So $5 ÷ ($8 + $5) = $5 ÷ $13 = 0.385, or about 38.5% of trades.
The decision rule: if your real share of winning trades sits above your breakeven figure after costs, that set of trades ended in profit. If it sits below, you need a bigger average win, a smaller average loss, or more winners.
You can also back out the ratio from a report that does not show it. Multiply the profit factor by the losing trades, then divide by the winning trades.
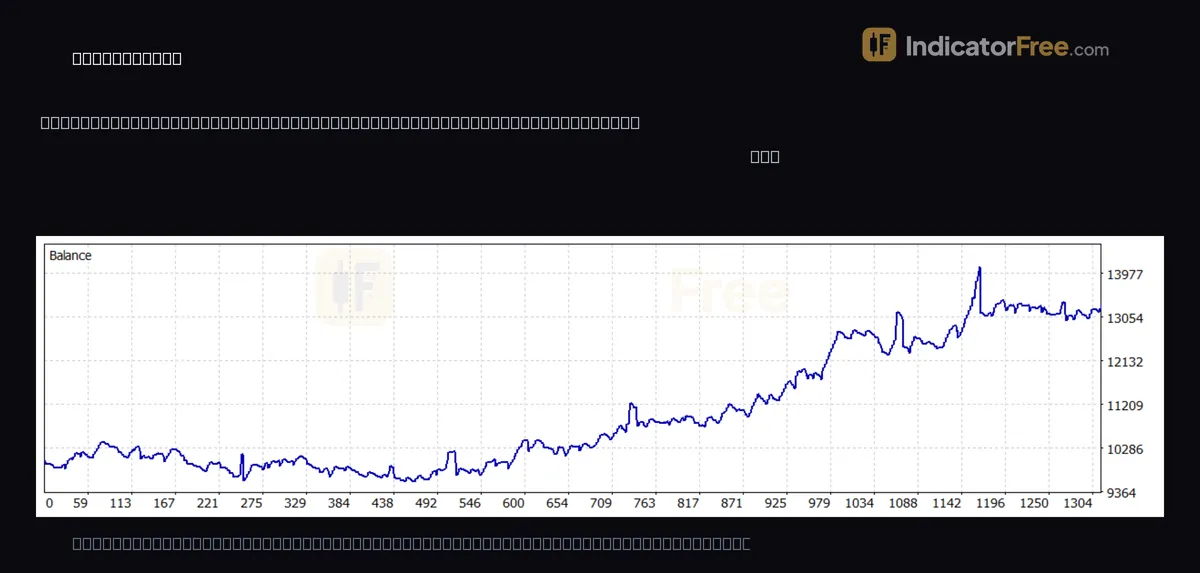
Take the backtest shown at the top of this page, run on 15-minute XAUUSD from 2026.03.24 to 2026.09.24. It had 908 trades, 457 of them profitable (50.33%), and a profit factor of 1.23. That leaves 451 losing trades, so 1.23 × 451 ÷ 457 ≈ 1.21. The average win was about 1.21 times the average loss. With roughly half the trades winning, that gap is where the whole profit came from. This is a past result, not a prediction.
Common ways to misread average win
The most common misread is an average lifted by one trade. Go back to the $5,000 account and swap the last $50 win for a single $1,050 win. Gross profit becomes $1,400 and the average win jumps to $280, as the chart below shows.
To spot it, recalculate without the largest winner: ($1,400 − $1,050) ÷ 4 = $87.50. If the number collapses like this, plan around the lower figure.
Other mistakes to avoid:
- Comparing money figures across accounts or lot sizes. An $80 average win on one account and $800 on another can be the same result. Compare in R.
- Mixing it up with the share of winning trades. Average win is an amount of money per winning trade. The share of winning trades is how many of your trades closed in profit. A report can look strong on one and weak on the other.
- Judging it without the average loss. A $200 average win is poor if the average loss is $400.
- Pushing the take profit further just to raise it. Fewer trades reach a distant target, so the average win rises while the number of winners falls.
You do not set average win anywhere. It is an outcome of your take-profit distance, your position size and how you exit. Most strategy reports list it next to the average loss.
FAQ
Does average win include commission and swap?
It depends on the report. Some count only the price profit of each trade, others use the net result after commission and swap. Check by adding one winning trade's costs by hand. Use the net figure for decisions, because costs shrink every win and deepen every loss.
Why is my live average win smaller than my backtest average win?
The usual causes are closing winners by hand before the target, worse exit prices from slippage and wider spreads, and trading a smaller position size than the test used. Convert both to R first. If the gap remains in R, the cause is your exits and not your size.