Overfitting
Also called Curve fitting, Curve-fitting, Over-optimisation, Over-optimization, Overfit strategy
Overfitting is when a trading strategy's rules or settings are tuned so closely to past price data that they capture its random noise instead of a repeatable pattern. The backtest looks excellent, then the results fade on new data.
An overfit strategy does not fail in the backtest. It fails after you fund it, because you chose your trade size and your drawdown limit from numbers that were never going to repeat.
Why optimisation produces overfit strategies: in-sample vs out-of-sample
Every price history mixes repeatable behaviour with one-off noise. Each rule or input you add gives a strategy one more way to bend around that noise. Traders also call this curve fitting.
In algo and quant trading it usually comes from optimisation: the software runs thousands of setting combinations and you keep the best one. With enough attempts, one combination will look excellent by luck alone.
Two terms make it testable. In-sample data is the history you tuned on. Out-of-sample data is history the strategy never saw during tuning. The drawing below shows the typical shape: a smooth rise while tuning, then a near-flat, choppy line on new data.
How an overfit backtest changes a live trade: a worked example
The figures here are an illustrative example. You optimise a trading robot on three years of history and test 2,000 setting combinations. The best one shows $6,000 net profit over 300 trades. You then run it on the following year, which you kept out of the tuning, and it makes $400 over 100 trades.
A rule of thumb, not a fixed law: if the strategy keeps less than about half of its per-trade result on unseen data, treat it as overfit and do not trade it at the planned size. If it keeps half or more, trade it at reduced size and keep comparing your live results with the out-of-sample figure.
Now the live trade. Suppose real spread and slippage cost you $5 more per trade than the test assumed. At $20 per trade you would barely notice. At $4 per trade the sum is $4 − $5 = −$1, so every trade loses on average.
Your drawdown limit has the same problem. You set it from a backtest that earned $20 per trade, but the strategy really earns $4, so the same run of losses takes $20 ÷ $4 = 5 times as many trades to win back. A limit that looked roomy in-sample is too tight, and ordinary losing streaks will hit it.
Spotting a lucky setting with the neighbour check
A real pattern survives small changes to its settings. A lucky fit does not. Continuing the example, the winning moving-average period was 23, so you look at the periods either side of it.
Period 23 makes $6,000 while its four neighbours make between $0 and $300. That is a spike, and a spike is noise. If the neighbours collapse like this, discard the setting. Prefer a plateau, where nearby values all give similar and more modest results, and pick the middle of it.
Where overfitting shows up on your trading platform
No platform has a setting called overfitting. You meet it in three places in the strategy testing tool:
- The optimisation results table. It is sorted by the result you asked for, so the top row is the best of everything tried, which is exactly where luck collects.
- The list of inputs you allow the optimiser to change. Each extra input multiplies the number of combinations tried.
- The date range. Most testers let you hold back part of the history as a forward period.
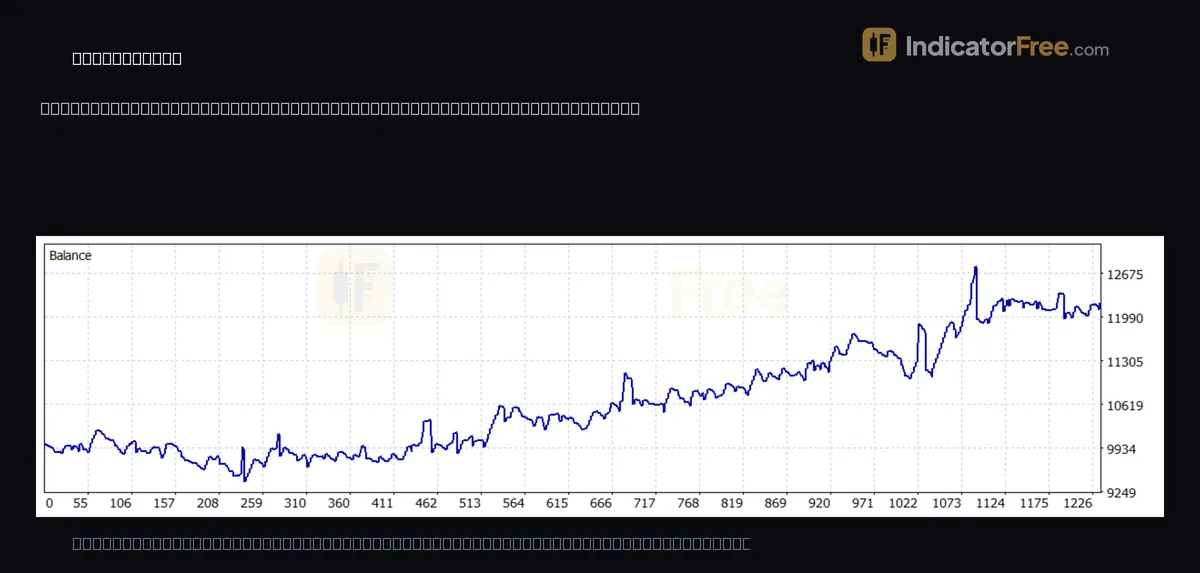
A single report cannot prove or rule out overfitting. The backtest report at the top of this page is a past example, not a prediction: gold against the dollar on the 15-minute chart, 2026.03.24 to 2026.09.24. Its 853 trades with a profit factor of 1.16 and an expected payoff of 2.62 per trade are a thin margin. Apply the same cost test as the worked example: an extra cost of 2.62 per trade, in the account currency, gives 2.62 − 2.62 = 0 and wipes the average out. Its history quality of 100% describes the price data, not the tuning. To judge it you would still need to know how many settings were tried and whether that expected payoff holds on dates outside the window.
Checks before you trade an optimised strategy
- Do the out-of-sample split and the neighbour check above for every input.
- Count the combinations tested. The more you tried, the less the best one means.
- Divide trades by optimised inputs. In the illustrative example, if six inputs were optimised, that is 300 ÷ 6 = 50 trades per input. More trades per input is safer; each input you add lowers the figure and makes the result more fragile.
- Look at whether the profit comes from a handful of outsized trades. Remove the few biggest winners and see if the rest still adds up to a profit.
- Test the same settings on a second symbol or timeframe. It should weaken, not collapse: if the per-trade result turns negative on every other market, treat the original as a lucky fit.
- Raise the spread and commission in the test and see whether the per-trade result survives.
- Be able to say in one sentence why the rule should work. If you cannot, the data chose it for you.
- Start live at the smallest size and compare the per-trade result with the out-of-sample figure, not the in-sample one.
FAQ
Can a manual strategy be overfit if I never run an optimiser?
Yes. Each time you scroll back, see a losing trade and add a filter to remove it, you are tuning by hand. Count the rules you added after looking at the chart and test the final version on a period you have not studied.
Does re-optimising every month fix overfitting?
Not by itself. It fits the strategy to the newest noise instead of the old noise. It only helps if each re-tuned version is then checked on the period that follows it, and those follow-on results are the ones you judge.
Can I reuse my out-of-sample period after changing the strategy?
Only with care. Once you adjust the rules because of what the held-back period showed, that period has become tuning data. Keep a final slice of history that you look at once, at the very end.