









Average loss
Also called Average losing trade, Average loss trade, Avg loss, Mean loss
Average loss is the typical size of your losing trades: the total money lost on all closed losing trades divided by the number of those trades. It is quoted as a positive amount in your account currency.
A strategy makes money only when share of winning trades × average win is larger than share of losing trades × average loss, so a small rise in average loss can turn a winning system into a losing one. The figure is also a quick discipline check, because it shows whether your losing trades really end where you planned them to end.
The average loss formula
Average loss = Total of all losing trades ÷ Number of losing trades
Count only closed trades that finished below zero, and write the result as a positive number. Include commission and overnight swap in each trade's result, because those costs are part of the loss.
Two companion numbers make it useful:
- Loss-to-plan ratio = average loss ÷ the money you planned to risk per trade. A value of 1.0 means your losses end where you planned.
- Payoff ratio = average win ÷ average loss.
Worked average loss for 500, 5,000 and 50,000 USD accounts
The figures in this section are an illustrative example. Three traders each plan to risk 1% of the account on every trade.
500 USD account. Planned risk is $500 × 1% = $5, and four trades lost $5, $5, $6 and $8.
5,000 USD account. Planned risk is $50. Ten trades lost: nine lost $50 each and one lost $200 after the stop was moved. The total is 9 × $50 + $200 = $650, so the average loss is $650 ÷ 10 = $65. The ratio is $65 ÷ $50 = 1.3.
The chart below shows why that average misleads. Nine of the ten losses sit exactly on plan, yet one trade lifts the average above every one of them.
50,000 USD account. Planned risk is $500. Twenty losing trades total $9,000, so the average loss is $9,000 ÷ 20 = $450. The ratio is $450 ÷ $500 = 0.9, because some trades were closed before the stop was hit.
Quick reference: average loss against planned risk
| Account | Planned risk (1%) | Losing trades | Total lost | Average loss | Loss-to-plan ratio |
|---|---|---|---|---|---|
| $500 | $5 | 4 | $24 | $6 | 1.2 |
| $5,000 | $50 | 10 | $650 | $65 | 1.3 |
| $50,000 | $500 | 20 | $9,000 | $450 | 0.9 |
Use the ratio as a decision rule:
- Above 1.0: losses run past your plan. Look for moved stops, slippage on fast markets, or position sizes rounded up.
- Close to 1.0: losing trades end where you planned.
- Below 1.0: you cut some trades early. Check that your average win has not shrunk by the same amount.
Estimating average loss from a backtest report
Some reports list profit factor and expected payoff but not the average loss. You can work it out from those.
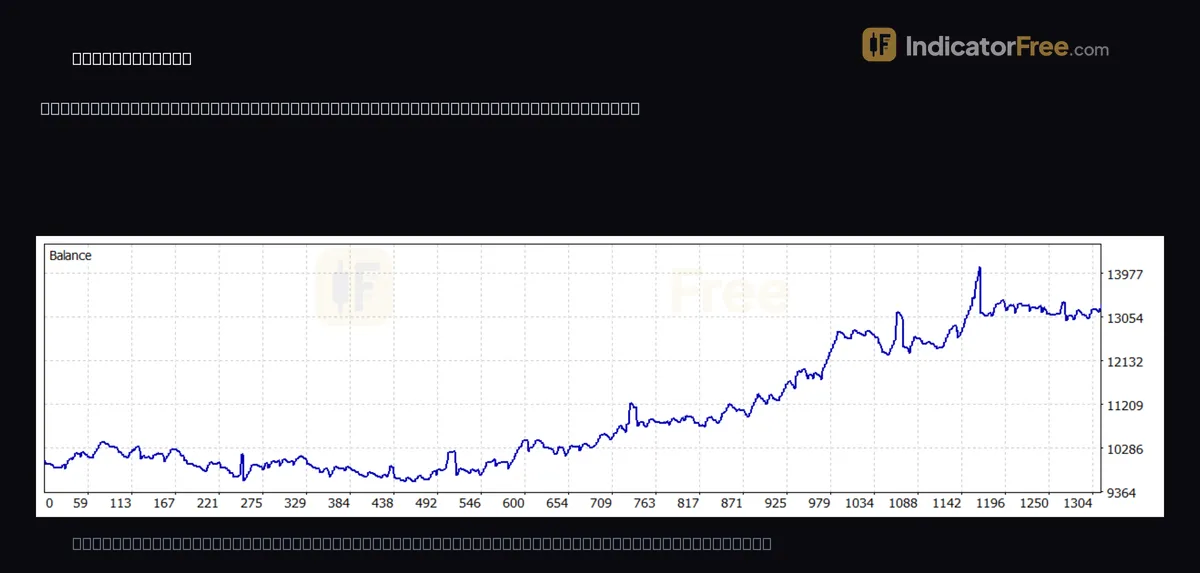
Take the backtest shown at the top of this page: an automated strategy on XAUUSD, 15-minute chart, 24 March to 24 September 2026. It reports 908 trades, 457 of them profitable, profit factor 1.23 and expected payoff 3.67. This is a past example, not a prediction.
Profit factor = gross profit ÷ gross loss. Expected payoff = average result per trade. Net profit = gross profit − gross loss = gross loss × (profit factor − 1), so gross loss = net profit ÷ (profit factor − 1).
- Net profit = expected payoff × trades = 3.67 × 908 = 3,332.36.
- Gross loss = net profit ÷ (profit factor − 1) = 3,332.36 ÷ 0.23 ≈ 14,490.
- Losing trades = 908 − 457 = 451.
- Average loss = 14,490 ÷ 451 ≈ 32 in the account currency.
The same steps give a gross profit of about 17,820 and an average win near 39, so the payoff ratio is roughly 1.2. Treat these as estimates: the profit factor is rounded to two decimals, so the average loss lands roughly between 31 and 33 depending on rounding, and the count assumes no trade closed at exactly zero.
Now put the two averages to work with one rule:
Break-even share of winning trades = Average loss ÷ (Average win + Average loss)
Here that is 32 ÷ (39 + 32) ≈ 45%. The report shows 50.33% profitable trades, which is above that line, so the test ended in profit. If your share of winning trades sits below that break-even share, the strategy loses money until the average loss comes down or the average win goes up.
Four mistakes that distort average loss
- Dividing by all trades. That gives a smaller, wrong number. Divide by losing trades only.
- Leaving out costs. A trade that lost $48 on price and $2 in commission lost $50.
- Comparing money amounts across accounts. $450 is a bigger number than $6, yet it is the smaller loss relative to plan. Compare the ratio or the percentage of the account.
- Counting open trades. A floating loss is not final. Only closed trades belong in the average.
Where to find average loss in your trade history
Average loss is a result, shaped by your stop-loss distance, position size and how you manage trades. Your trading platform usually shows it in the account history statistics or in the strategy test report, on a line such as "average loss trade" next to the average profit trade. If it is missing, export the closed trades and apply the formula in a spreadsheet.
FAQ
What is a good average loss in trading?
There is no universal figure. A larger average loss is acceptable only if the share of winning trades or the average win makes up for it. In the backtest above, an average loss near 32 needs about 45% winning trades; if it rose to 39, equal to the average win, it would need 39 ÷ (39 + 39) = 50%, almost all of the 50.33% the report shows.
How do I calculate average loss in options, futures or stock trading?
The formula is the same in every market: total money lost on losing trades divided by their number. Only the source of the loss changes. An option buyer cannot lose more than the premium paid on a trade, while futures traders and option sellers can lose more than the margin they posted, so their largest loss deserves extra attention.
How many losing trades do I need before the average is reliable?
The fewer the trades, the more one result moves the number. With four losses, each trade carries a quarter of the weight: three $50 losses and one $200 loss average $87.50, while the same $200 loss among the ten in the 5,000 USD example gives $65. With several hundred, as in the backtest above, one trade barely shifts it.