









Risk per trade
Also called per-trade risk, risk per position, trade risk, account risk per trade, percent risk per trade
Risk per trade is the part of your account you accept losing if a single trade hits its stop loss, set as a percentage of the account or as a fixed sum of money. You decide it before you enter, and it sets your position size.
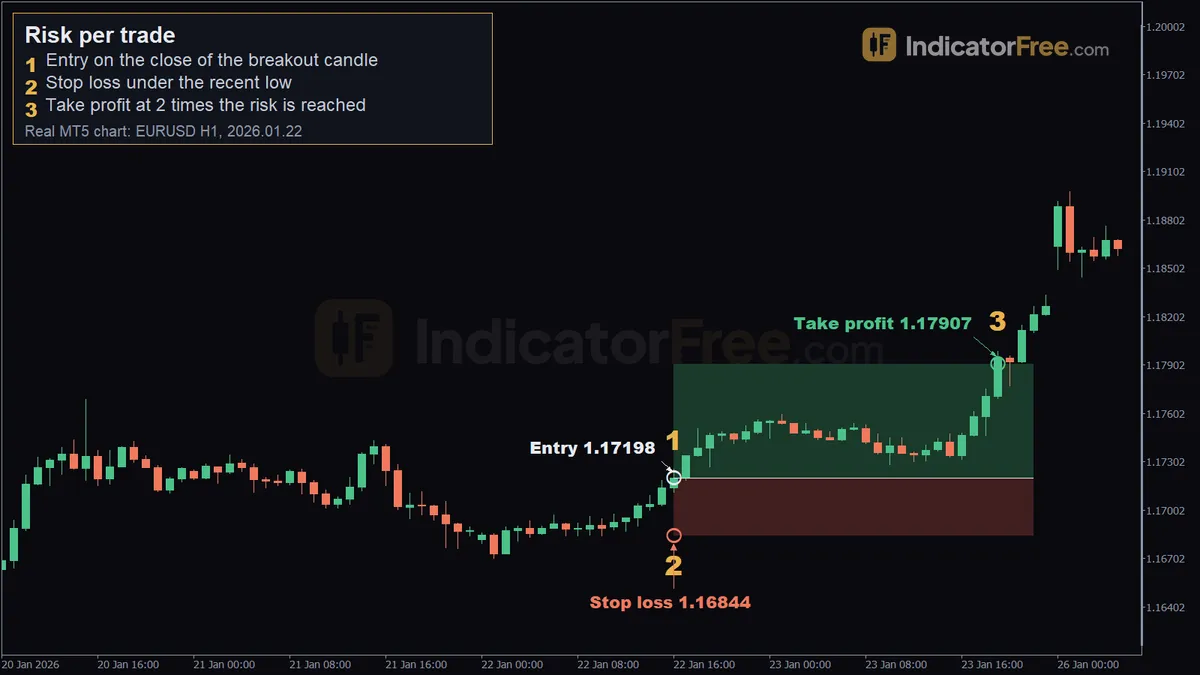
Fix this number first and the lot size follows from it. Pick the lot size first and your loss is whatever the stop happens to cost. The chart at the top of this page is a past EURUSD 1-hour trade, not a prediction: entry at 1.17198, stop loss at 1.16844 (35 pips of risk) and take profit at 1.17907 (71 pips), reached on 2026.01.23 19:00. The entry marker on the chart reads 1.17255, which is where the breakout candle closed. The trade's entry price is 1.17198, and the 35-pip and 71-pip distances are measured from that price. The calculations below borrow its 35-pip stop.
The risk per trade formula
Risk in money = account balance × risk %
Position size (lots) = risk in money ÷ (stop distance in pips × pip value per lot)
The stop distance is the gap between your entry and your stop loss. The pip value per lot is what one pip of movement is worth on one lot.
The chart decides the stop and you decide the percentage. The lot size is the only thing left to adjust. If the stop is twice as wide, the lot size halves and the money at risk stays the same.
Risk per trade worked out step by step on a 5,000 USD account
The figures here are an illustrative example: 1% risk, a 35-pip stop, and EURUSD, where one standard lot of 100,000 units is worth $10 per pip.
For the $5,000 account:
- Risk in money: $5,000 × 1% = $50.
- Cost of one lot at the stop: 35 × $10 = $350.
- Raw size: $50 ÷ $350 = 0.1429 lots.
- Round down to 0.14 lots. Real loss at the stop: 0.14 × $350 = $49.
Always round down. The figure below shows that rounding up to 0.15 lots breaks the $50 budget.
The same sum shows the other side of the trade. With the 71-pip target, 0.14 lots would gain 0.14 × 71 × $10 = $99.40 against $49 at risk.
Use this rule on small accounts: if the smallest order size costs more than your budget, skip the trade or find a tighter valid stop. Do not raise the risk. At 0.5% the $500 account has $2.50 to lose, and 0.01 lots at 35 pips costs $3.50.
Lot size lookup by account, risk % and stop distance
This table uses the same illustrative setup: EURUSD on a USD account, $10 per pip per standard lot, with every size rounded down to 0.01 lots. Each cell shows the order size and, in brackets, the real loss at the stop.
| Account | Risk % | Risk in money | 20-pip stop | 35-pip stop | 70-pip stop |
|---|---|---|---|---|---|
| $500 | 1% | $5 | 0.02 ($4.00) | 0.01 ($3.50) | Skip: 0.01 lots costs $7.00 |
| $500 | 2% | $10 | 0.05 ($10.00) | 0.02 ($7.00) | 0.01 ($7.00) |
| $5,000 | 1% | $50 | 0.25 ($50.00) | 0.14 ($49.00) | 0.07 ($49.00) |
| $5,000 | 2% | $100 | 0.50 ($100.00) | 0.28 ($98.00) | 0.14 ($98.00) |
| $50,000 | 1% | $500 | 2.50 ($500.00) | 1.42 ($497.00) | 0.71 ($497.00) |
| $50,000 | 2% | $1,000 | 5.00 ($1,000.00) | 2.85 ($997.50) | 1.42 ($994.00) |
How much to risk per trade as a day trader or swing trader
A common rule of thumb in stock and forex trading is to risk no more than 1% to 2% of the account on one trade. It is a ceiling, and many traders stay below it.
Day traders often go under 1% because they take several trades in one session, so losses can stack up within hours. Swing traders can keep the same percentage. Their stops are wider, so their lot size is smaller for the same money at risk.
Test any percentage against a losing streak. The chart below shows what is left of an account after 10 losses in a row, with each loss taken on the reduced balance.
If the bar for your percentage shows a loss you could not keep trading through, lower the percentage.
Risk per trade mistakes that enlarge the loss
- Choosing the lot size first. A fixed 0.10 lots risks $35 with a 35-pip stop and $70 with a 70-pip stop. Your risk then changes on every trade without you deciding it.
- Widening the stop after entry. The lot size was calculated for the original stop. Every extra pip adds risk you did not plan.
- Counting each trade alone. Three open trades at 1% on pairs that move together behave like one trade at 3%.
- Using the wrong pip value. $10 per pip per standard lot is only true when USD is the second (quote) currency, as in EURUSD, and your account is also in USD. For USDJPY, or for a EUR or GBP account, work out the value with the rule below before you divide. Gold uses a different contract size, so check its contract details.
- Treating the stop as a hard limit on the loss. Spread, slippage and weekend gaps can fill you beyond the stop, so the real loss can exceed the planned one.
How to find the pip value for USDJPY or a non-USD account
Pip value per lot = 100,000 × pip size ÷ price of 1 unit of your account currency in the pair's quote currency
The pip size is 0.0001 for most pairs and 0.01 for pairs quoted in Japanese yen. When your account currency is the quote currency, the divisor is 1, so EURUSD on a USD account gives 100,000 × 0.0001 = $10.
Illustrative example: USDJPY at 150.00, a $5,000 USD account, 1% risk and a 35-pip stop.
- One pip on one lot: 100,000 × 0.01 = 1,000 yen.
- In dollars: 1,000 ÷ 150.00 = $6.67 per pip.
- Cost of one lot at the stop: 35 × $6.67 = $233.45.
- Size: $50 ÷ $233.45 = 0.2142 lots. Round down to 0.21 lots, which loses about $49 at the stop.
On a EUR account trading EURUSD, the same rule divides the $10 by the EURUSD price. So while EURUSD trades above 1, one pip on one lot is worth less than €10.
Where you set risk per trade on your trading platform
Most order windows ask for a volume in lots or units and do not ask for a risk figure. You do the calculation yourself and type in the result together with the stop loss price.
Some platforms and charting tools let you enter the risk as a percentage or a sum of money. Once you place the entry and the stop, they work out the quantity. A long or short position drawing tool on a chart often does the same when you give it the account size and risk percentage.
Before you confirm, check that the money shown next to the stop loss matches your budget. If it does not, the lot size is wrong.
FAQ
How much should I risk per trade on a prop firm or funded account?
Start from the firm's daily loss limit and maximum drawdown, not from the balance. Divide the daily loss limit by the number of losing trades you want room for in one day. As an illustration, a 4% daily limit with room for four losses means risking under 1% per trade, which leaves a margin for slippage.
Should I calculate risk per trade from balance or equity?
Use the lower of the two. If open trades are losing, equity is below balance, and sizing from balance would risk more than you intend.
Does my risk per trade change after a win or a loss?
With a percentage, the money amount moves with the account. After a drop from $5,000 to $4,500, 1% is $45 instead of $50. Recalculate before every trade instead of reusing the previous lot size.