









Backtest
Also called backtesting, back test, strategy backtest, historical test
A backtest runs a trading strategy's rules over past price data to show how it would have traded: how many trades it took, how much it made or lost, and how deep the losing streaks went.
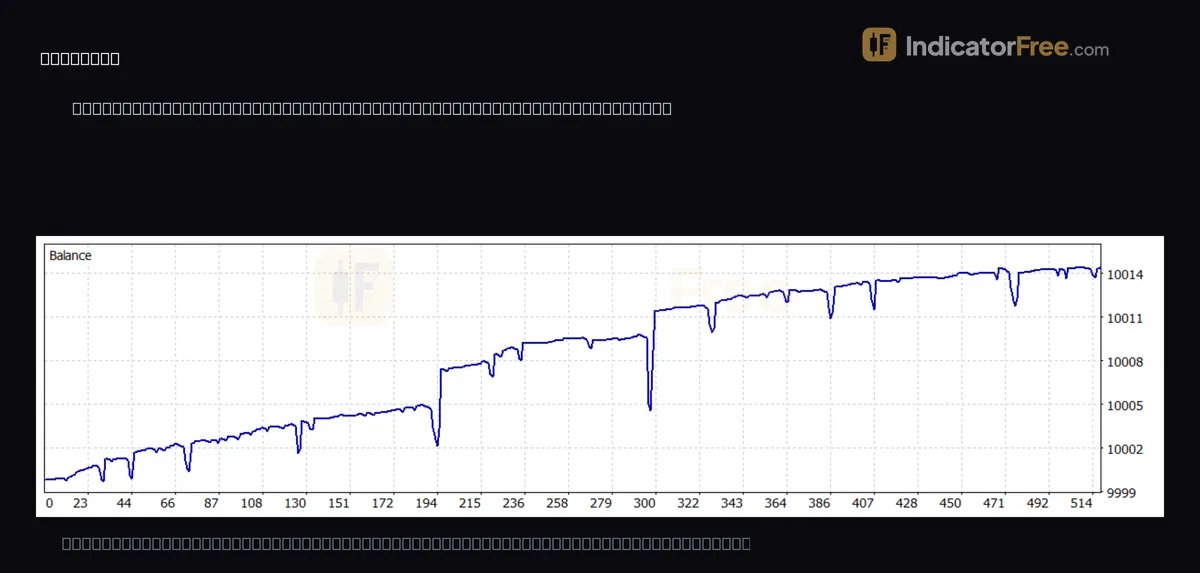
A backtest result is hypothetical: no order was really filled. A tester can apply a fixed spread and commission, but it cannot reproduce widening spreads, slippage or rejected orders. Use it as a cheap way to reject bad ideas, not as proof that a strategy will make money.
What a backtest does with past prices
You start with fixed rules: when to enter, when to exit, where the stop goes and how big the position is. The test then walks through history one bar at a time, applies those rules as if the market were live, and logs every trade.
In algo trading the rules are code, so the software runs the test far faster than you could by hand and removes hindsight from the decisions. A discretionary trader can do it by hand: scroll the chart back, move forward bar by bar, and write each trade in a sheet. This is slower, and it is easier to cheat because you can already see what happened next.
What the report at the top of this page really says
The report at the top of this page is a real past example, not a prediction. It is an EA backtest on EURUSD on the 15-minute chart from 2026.06.24 to 2026.09.24, with 258 trades, a profit factor (gross profit divided by gross loss) of 1.36 and 100% history quality.
The common misread is to stop at the share of winning trades. 196 of the 258 trades won (75.97%), yet profit factor is only 1.36. That means the average loss was far larger than the average win, so a high share of winning trades does not by itself make a report good.
Next, read expected payoff, the average result per trade in account currency. Here it is 0.05, and it is already net of the spread and commission the tester applied, so any extra live cost comes straight out of that figure.
Drawdown is the fall from an account peak to the next low. Balance drawdown counts closed trades only, while equity drawdown also counts trades that are still open. Maximum balance drawdown was 5.06 (0.05%) but maximum equity drawdown was 20.22 (0.20%), so open trades went about four times deeper underwater than the closed-trade curve shows. The rule: read equity drawdown, not balance drawdown.
Recovery factor is net profit divided by the largest equity drawdown. At 0.70, the strategy earned less than its worst dip of 20.22 (0.20%). Three months is also only one stretch of market.
Reading a backtest report: a worked example with costs
The figures in this example are illustrative. A backtest of 200 trades shows $9,000 of winning trades and $6,000 of losing trades, with a fixed spread and commission already applied. Then you add $5 per trade for the extra live cost a tester cannot reproduce: wider spreads and slippage.
A cost of $5 per trade removed a third of the profit. Copy this sum for your own report, then apply one rule: if doubling the cost per trade wipes out the profit, the edge is too thin to trade. Here, $10 per trade costs $2,000 and leaves $1,000, so this example passes.
Why a good backtest can fail live: curve fitting
Curve fitting (also called overfitting) means adjusting settings until they match the past perfectly. The strategy has learned that one piece of history, not a pattern that repeats.
The check is to split your data. Tune the settings on the first part only, then run them unchanged on the part the strategy has never seen. The chart below shows what an overfitted strategy looks like when you do this.
If the unseen part falls apart, discard the settings. Do not re-tune them on the second part, because then no unseen data is left.
Four backtest settings that change the result
Four inputs in your platform's tester decide how honest the result is.
| Setting | What it changes | How to set it honestly |
|---|---|---|
| Date range | Which market conditions the strategy meets | Include trending, ranging and news-heavy stretches, and keep the last part aside as unseen data |
| Spread and commission | How much each trade costs | Enter what your own account charges, not the tester's default |
| Price data detail | Whether stops and targets inside a bar fill in the right order | Use the most detailed price data the tester offers |
| Starting deposit and lot size | The size of profit and drawdown in money | Match the deposit and position size you would really trade |
Checks before you trust a backtest with real money
- Look at data quality first. Gaps or coarse data make every other number unreliable.
- Compare the largest drawdown with what you could sit through without switching the strategy off.
- Check that a handful of large winners do not supply most of the profit.
- Run the unchanged strategy on a demo account, then compare its trades with the backtest for the same days.
FAQ
How many trades does a backtest need before I can trust it?
There is no fixed number. You need enough trades that removing the few best ones does not change the conclusion, and enough that they are spread across different market conditions instead of bunched in one stretch.
What is the difference between backtesting and forward testing?
A backtest runs the rules on prices that have already happened. Forward testing runs the same rules on new prices as they arrive, so you cannot see what comes next and the fills and costs are real rather than simulated.