









Maximum drawdown
Also called MDD, max drawdown, max DD, maximum equity drawdown, peak-to-trough drawdown
Maximum drawdown is the largest fall of an account or strategy from a high point to the lowest point that follows, before a new high is made. It is shown in money and as a percentage.
This number tells you how much pain a strategy asked for on the way to its profit. Two systems can end with the same gain, yet one may have lost a fifth of the account along the way. If you could not have sat through that fall, you would never have reached the final profit.
Measuring the fall from peak to trough
A drawdown is any drop from a high in the account. Maximum drawdown is the deepest one in the period you are looking at.
It is measured from the highest point reached, not from your starting deposit. The count only resets when the account makes a new high.
Reports usually give two versions:
- Balance drawdown counts closed trades only.
- Equity drawdown also counts the floating loss on trades that are still open. Equity is your balance plus or minus open trades.
Equity drawdown is usually the larger of the two, and it is closer to what you would have felt. A wide gap between them means the strategy sits in losing trades for a long time, as grid and averaging systems do.
Worked example: a $12,000 peak that falls to $9,600
The figures here are an illustrative example. You start with $10,000 and grow it to $12,000. A losing run takes the account to $9,600, and it later climbs to $13,000. The drawing below shows that path.
The arithmetic takes three steps, and you can redo it with your own numbers.
The common misread is "I am only $400 below my deposit". The drawdown is $2,400, because the account had already reached $12,000.
Why a deep drawdown is so hard to win back
Gain needed = drawdown ÷ (1 − drawdown)
Losses and gains do not balance out. After a fall you rebuild from a smaller account, so the gain you need grows faster than the drawdown.
Work in decimals. A 30% drawdown gives 0.30 ÷ 0.70 = 0.43, so you need about a 43% gain just to get back to the peak. The chart below shows four cases.
Use this when you read a report. A 50% maximum drawdown means the strategy had to double what was left of the account just to break even.
Using maximum drawdown to set your trade size
With a fixed trade size, drawdown grows roughly in line with that size. That gives you a rule you can copy:
Size multiplier = drawdown you can accept ÷ drawdown you expect
In the example, the strategy showed 20%. If 10% is the most you can sit through, 10 ÷ 20 = 0.5, so you trade half the tested size.
Treat a tested maximum drawdown as a floor, not a ceiling. A backtest is one path through past prices, and a longer history can always contain a deeper fall.
A second rule follows from that. If your live drawdown goes clearly past the tested maximum, stop and review. The strategy is now behaving outside what the test showed.
Checking a real backtest: equity 7.41% vs balance 6.68%
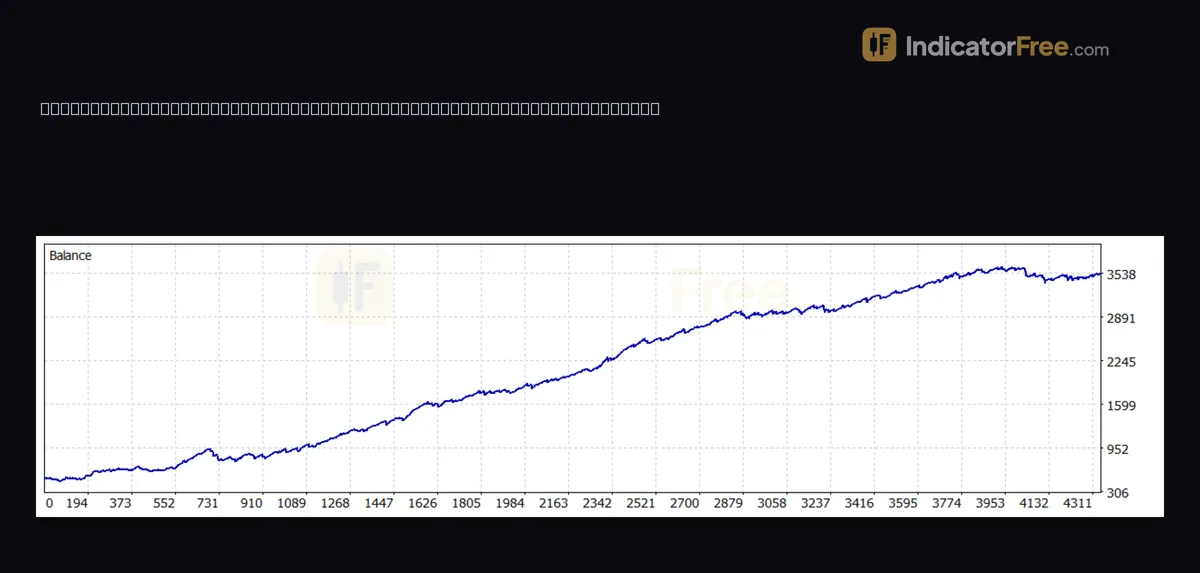
A past backtest of an automated strategy on gold (XAUUSD), on the 1-minute chart from 26 July to 26 September 2026, placed 2165 trades. Its maximum equity drawdown was 269.76 (7.41%) and its maximum balance drawdown was 243.17 (6.68%).
Equity 7.41% vs balance 6.68%, so the strategy held losing trades open. Equity drawdown already includes the closed losses, so a gap under one percentage point means open losses added little on top of them.
Now apply the tools from above. With the recovery formula, 0.0741 ÷ (1 − 0.0741) = 0.08, so the account needed about an 8% gain to climb back to its equity peak. With the size rule and an illustrative limit of 5%, 5 ÷ 7.41 ≈ 0.67, so you would trade about two-thirds of the tested size, assuming the test used a fixed size.
The same report shows a recovery factor of 11.24, which is net profit divided by maximum drawdown. It is a past result, not a prediction.
Checks before you trust a drawdown figure
- Balance or equity? Judge a strategy by its equity drawdown. A balance figure alone can hide open losses.
- How long was the test? A two-month sample, like the example above, cannot show what a bad year looks like.
- Percent of what? Some reports divide by the peak and others by the starting deposit. The same money loss gives different percentages.
- What trade size was used? A fixed size and a size that grows with the account produce different drawdowns from the same trades.
- How long did recovery take? A shallow drawdown that lasts months can be harder to trade than a deep one that lasts days.
- Read it before the profit. Compare the drawdown with your own limit first, then look at the gain.
Drawdown limits on funded accounts
A drawdown limit is a rule, not a statistic. A prop firm or funded account sets a maximum loss, and reaching it closes or fails the account.
There are two common types. A static limit sits a fixed distance below your starting balance and never moves. A trailing limit follows your account's highest point upward and stays the same distance below each new high.
Illustrative example: you start with $10,000 and the limit is $1,000. The static line stays at $9,000. When the account climbs to $11,500, the trailing line moves up to $10,500. A pullback to $10,400 then breaks the trailing rule, even though you are still above your starting balance and far from the static line.
With a trailing limit, profit you give back counts against you. Your room to lose is measured from the last high, the same peak-to-trough idea as maximum drawdown.
FAQ
What is a good maximum drawdown for a forex strategy?
There is no single good number. Compare it with the profit it produced, and with the loss you could watch without closing everything. If you trade under a drawdown limit, the figure has to fit well inside it.
Is a trailing drawdown limit checked on balance or equity in real time?
That depends on the firm's rules. If the limit tracks equity in real time, a floating loss on an open trade can breach it, even if that trade later closes in profit. If it tracks balance, only closed trades count. Read the rules to see which one applies, and whether the trailing line ever stops rising.
What does max drawdown tell me about a copy-trading provider?
It shows the worst fall that provider's account went through at their trade size. Your own fall scales with how much you copy. Check that the figure includes open trades, because a smooth balance curve can sit on top of large floating losses.