Recovery factor
Also called RF, recovery ratio
Recovery factor is a trading system's net profit divided by its maximum drawdown. It shows how many times the strategy earned back its worst peak-to-low loss during the test period.
Net profit alone hides the ride. Two Expert Advisors can finish a test with the same profit, yet one got there after a shallow dip and the other nearly emptied the account first. Recovery factor puts both facts into one number, so you can compare systems before real money is at risk.
The recovery factor formula
Recovery factor = Net profit ÷ Maximum drawdown
Both inputs are in account currency. Net profit is all winning trades minus all losing trades over the test. Maximum drawdown is the largest drop from an account high to the low that followed it, measured in money.
You do not set recovery factor; it is a result. Your trading platform's strategy tester or backtest report lists it beside profit factor and drawdown, and if yours does not, the two inputs are always there to divide yourself.
The chart below shows both inputs on one equity curve.
A reading of 1.0 means the whole test only earned back its worst drop once.
Calculating recovery factor for three EAs: why the most profitable one ranks last
The figures here are an illustrative example: three EAs, each tested on the same $10,000 account over the same 12 months with no deposits or withdrawals. Account size does not change the ratio, because profit and drawdown are in the same currency on the top and the bottom. With one account for all three, the only difference left is the shape of profit against drawdown.
Start with EA A:
- Net profit: end balance $13,000 − start balance $10,000 = $3,000.
- Maximum drawdown: equity peaked at $11,200, then fell to $10,200, a drop of $1,000.
- Divide: $3,000 ÷ $1,000 = 3.0.
EA B made $3,000 and its worst drop was $2,000. EA C made $4,000 and its worst drop was $5,000.
Now compare returns. EA C earned 40% ($4,000 ÷ $10,000), more than the 30% on the other two. It still has the worst recovery factor, because at one point it had given back $5,000, half the starting balance. Ranking by profit would have picked the system that was hardest to sit through.
What counts as a good recovery factor
These bands are a working rule of thumb, not an industry standard.
| Recovery factor | What it tells you | What to do |
|---|---|---|
| Below 0 | The test ended in a loss | Reject |
| 0 to under 1.0 | Worst drop was bigger than total profit | Reject or rework |
| 1.0 to under 2.0 | Profit is one to two times the worst drop | Treat as fragile; test a longer period |
| 2.0 to under 3.0 | Profit is at least twice the worst drop | Check trade count and test length |
| 3.0 and above | Profit is several times the worst drop | Confirm on a different period before trusting it |
There is a catch: the number grows with time. Profit keeps adding up over time while drawdown grows only when a worse drop arrives, so a longer test usually shows a higher value.
So use this rule: compare only tests of equal length, or divide by the number of years. Dividing by years is a rough fix, not an exact one, because a longer test can also meet a deeper drawdown. As an illustration, 6.0 earned over three years is 2.0 per year, which is weaker than 3.0 earned in one year. The per-year division only works for tests of a year or more; for a shorter test, extend the test instead of scaling the number up.
Reading the recovery factor in a real backtest report
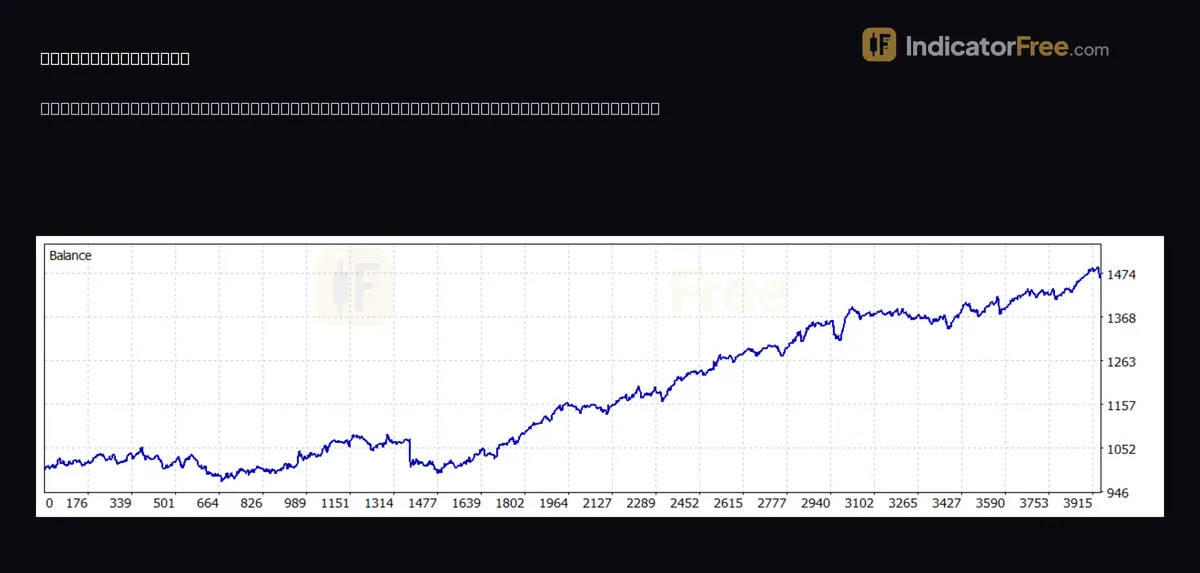
The backtest report at the top of this page is a past example, not a prediction. It covers an EA on XAUUSD, 1-minute chart, from 2026.07.27 to 2026.09.27, with 1966 trades. The recovery factor is 4.91 and the maximum equity drawdown is 95.07 (8.75%).
You can multiply back to check it: 4.91 × 95.07 ≈ 467 and 4.91 × 94.79 ≈ 465, so about 465 to 467 in net profit, depending on which drawdown the report divides by. Check which one your own report uses before you compare two systems: divide net profit by each drawdown; the one that gives the reported recovery factor is the one used.
The test spans only two months, which is too short to have met a real losing stretch, so 4.91 cannot be compared with a multi-year result. It sits in the "3.0 and above" band, but the table's action applies: confirm on a different period.
Read the drawdown percent beside the recovery factor. A good ratio with a drawdown that is a large share of the account is still hard to hold; here the worst drop was 8.75% of the account.
The report also lists two drawdowns: equity 95.07 and balance 94.79. Equity drawdown includes the floating loss on open trades; balance drawdown counts closed trades only. The drawing below shows the difference.
In this report the two are close. On a grid or martingale EA that holds losing positions, the gap can be wide, and a balance-based figure flatters the system.
Three recovery factor misreads to avoid
- Reading it as recovery speed. The name makes it sound like a measure of how fast the system climbs back after a loss, but time is not part of the formula. The drawing above shows two systems with the same profit, the same maximum drawdown and so the same recovery factor, yet one spends a long flat stretch below its old high. To check, find the longest stretch between one equity high and the next on the curve, or read the drawdown duration if your report shows it.
- Trusting it on a handful of trades. A few lucky wins and no real losing streak produce a huge ratio that means nothing. Decision rule: if the test has too few trades to include at least one real losing streak, ignore the ratio. As a rule of thumb, not an industry standard, look for at least 100 trades and at least one run of several losses in a row on the equity curve. The real report above passes the count with 1966 trades; its test length is a separate issue, covered in the report section.
- Treating maximum drawdown as a ceiling. It is only the worst drop so far, and live trading can set a deeper one. As a working rule, not an industry standard, plan the live account so that a drawdown of about twice the tested maximum is still survivable. For EA A in the illustrative example above, that means being able to sit through a $2,000 drop, not just $1,000.
FAQ
Why can the recovery factor be high when the profit factor is low?
Profit factor is gross profit divided by gross loss, so it measures the edge per dollar lost. The past backtest above shows a profit factor of 1.18 with a recovery factor of 4.91: a thin overall edge (each $1 lost brought back $1.18), repeated across 1966 trades, while the worst drop stayed small.
Does changing lot size change the recovery factor?
With a fixed lot, no. Doubling the lot roughly doubles both profit and drawdown, so the ratio stays the same. With compounding or a lot multiplier, position size changes during the test and the ratio moves with it.
Can I calculate recovery factor for manual trading?
Yes. First subtract deposits and add back withdrawals, so only trading results are left. Then take your net profit for the period, find the largest peak-to-low drop in your equity over the same period, and divide the first by the second.