









Tick data
Also called tick history, tick-by-tick data, real ticks, every tick data, historical ticks
Tick data is the record of every price update in a market: each new bid and ask quote with its exact time stamp. Backtests use it to replay how the price really moved inside each candle.
Tick data is the finest record of quoted prices most retail traders can get, far finer than a 1-minute candle. If your strategy takes small profits or uses tight stops, a test on candles alone can show a profit that real ticks would remove.
What one tick records
A tick is one update of the price. In forex, each tick holds three things: a time stamp, the bid (the price you can sell at) and the ask (the price you can buy at).
The gap between bid and ask is the spread. So tick data also stores the real spread at every moment, including the moments when it widens.
Forex has no single exchange, so there is no single official tick record. Each broker and data vendor publishes its own stream. Two tick files for the same pair and the same day will differ slightly, and so will backtests run on them.
Why a candle cannot tell you which level was hit first
Suppose you buy at the open of a 1-minute candle. Your stop loss and your take profit both sit inside that candle's range. From the candle alone, nobody can say which one was touched first.
The drawing below shows that case. The candle closes higher and looks like a winning trade. The ticks inside it show the price falling to the stop before it rallied to the target, so the trade was a loss.
A tester without ticks has to guess the order. A tester that assumes the price went straight from open to high books the take profit, although the real ticks hit the stop first. That is how a losing scalper can look profitable on paper.
How tick data changes a backtest result, in numbers
The figures here are an illustrative example. An Expert Advisor (EA, an automated strategy) scalps EURUSD with 0.10 lots, so one pip is worth $1. It takes 1,000 trades.
A coarse test assumes a fixed spread of 1.0 pip and reports an average net gain of 1.0 pip per trade. The tick data shows something else: the EA enters during fast moves, when the real spread averaged 1.6 pips.
The strategy is the same and so are the trades, but more than half of the profit is gone. You can copy this check: multiply your number of trades by the extra cost per trade and by your pip value.
Compare your average target with the spread to decide whether a coarse test is good enough:
- If your average net profit per trade is only a few spreads or less, the coarse test is not trustworthy. Rerun it on real ticks.
- If your stop loss or take profit sits within a few spreads of the entry, a wider spread alone can trigger it. Rerun the test on real ticks.
- If your average target is many times the spread, a coarse test is usually close enough. A strategy that aims for hundreds of pips on daily candles barely notices 0.6 pip. A scalper lives or dies by it.
Where you see and choose tick data on your trading platform
In live trading, the ticks are the flickering bid and ask in your quote list.
In a strategy tester, you choose how prices are modelled. The names vary by platform, but the choices usually look like this:
| Price model | What it uses | Speed | When it is enough |
|---|---|---|---|
| Bar opens only | One price per candle | Fastest | Strategies that act only when a new candle opens |
| Generated ticks | Ticks invented from 1-minute candles. Spread and tick order are simulated, not recorded | Medium | First rough tests of slower strategies |
| Real ticks | Recorded bid and ask from a broker | Slowest | Scalpers, tight stops, trailing stops, news trading |
Real ticks are large files, so long test periods are slow.
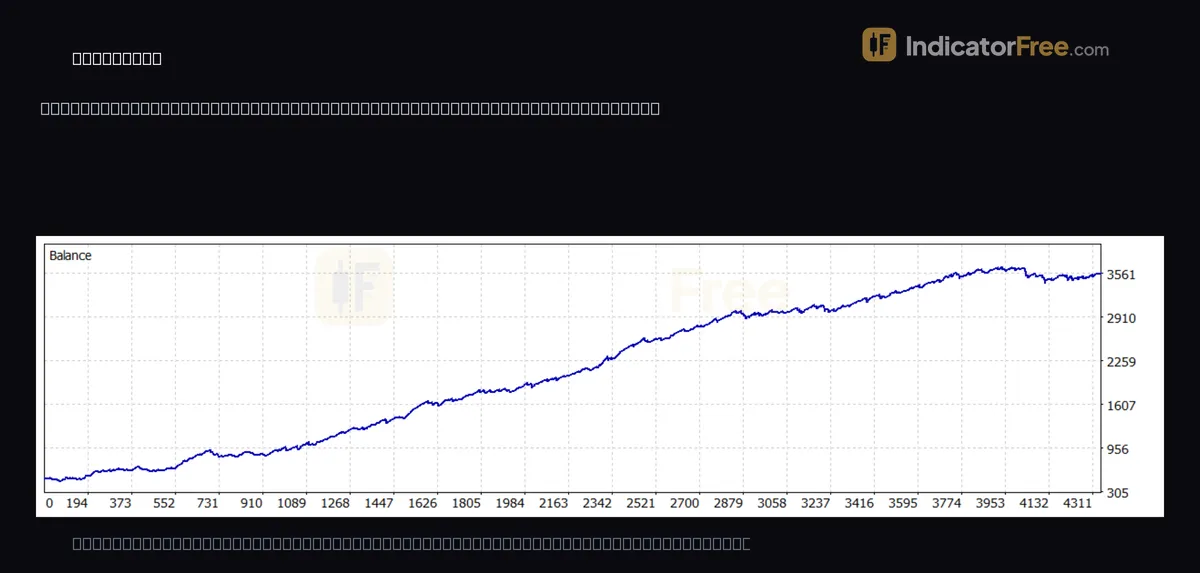
After a test, find the data-quality figure in your test report. The EA backtest report at the top of this page, a past XAUUSD test on the 1-minute chart, shows 100%. That says the price data was complete. It does not prove real ticks were used, so check the line that names the price model as well. With 2165 trades and an expected payoff of 1.41 per trade, it is the kind of many-small-trades strategy where the price model matters most.
Checks before you trust a tick-data backtest
- Use the broker you will trade with. Their ticks carry their spreads. Another source tests another market.
- Confirm the test used real ticks with a variable spread. Generated ticks or one fixed spread throw away most of the advantage shown above.
- Look for gaps around weekends and holidays. Tick files often have missing stretches near the weekly open and on thin holiday sessions. A gap can hide a price jump that would have hit your stop.
- Match the time zone of the tick file to the broker's server time. If they differ, daily candles, session filters and news-time rules in your strategy fire at the wrong hours.
- Make the test period long enough to include high-spread news days. A quiet stretch with no major releases or central bank decisions shows only normal spreads and flatters a scalper.
- Look at trades that open and close inside one candle. Many of these means the result depends heavily on tick order.
- Remember what ticks do not include. Slippage, requotes and execution delay are not in the file. Even a perfect tick test is still hypothetical performance.
FAQ
What is tick size in the stock market?
Tick size is the smallest price step a share or future is allowed to move, set by the exchange. Tick data is the record of every quote and trade. One is a rule, the other is a history.
Can I download tick data from a charting website?
Sometimes. Many charting sites show candles built from ticks but export only the candles. Tick history is often limited to recent days or to paid plans. Check what the export really contains before you build a test around it.
Can I trade a strategy directly on tick data?
Yes. Tick charts draw a new bar after a set number of price updates instead of a set time, and some scalpers use them to read short bursts of activity. Costs weigh heavily at that scale, so test with real spreads first.