









Tick volume
Also called Tick count, Tick activity
Tick volume is the number of price changes (ticks) a price feed records during one candle. In forex, where no central exchange reports how much was traded, it is the usual way to judge how active the market was.
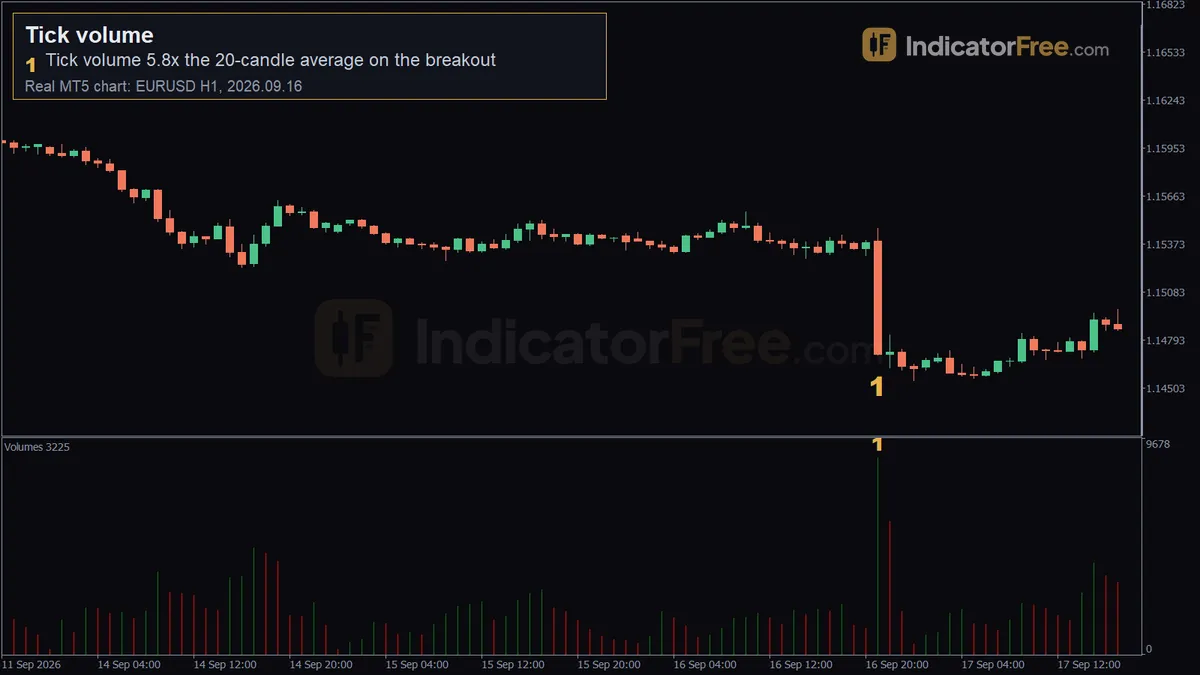
Every candle you trade also tells you how busy the market was while it formed. A breakout on thin activity has few traders behind it. If price snaps back, you are the one holding the losing trade.
Why forex counts ticks instead of contracts
Forex has no central exchange, so nobody sees the total amount traded on a pair. Each price feed can only count how often its own quote changed. A tick is one change in the bid or ask price.
When more orders arrive, the quotes update more often, so the count rises with real activity. It does not measure size. One tick can come from a tiny order or a very large one. Read tick volume as a measure of activity, not of money traded.
Futures and stock exchanges publish real volume, which is the number of contracts or shares that actually changed hands. If your market reports real volume, use it. Tick volume is the stand-in when it does not.
Six checks for a tick volume spike that matters
- Pick a lookback, such as the last 20 closed candles, and average their tick volume.
- Divide the tick volume of the candle you are judging by that average. The result is the spike ratio.
- Below 2x, treat the candle as ordinary. From 2x to 3x, it is notable. At 3x or more, it is a spike. These are working thresholds, not fixed laws.
- Check that the candle closed beyond a level that matters, such as a range high or low or a swing point. Trading through the level and closing back inside does not count.
- Compare with the same hour on the previous few days. If that hour is busy every day, for example a session open, the spike proves less.
- Read the direction from the candle body and its close. Tick volume has no direction.
The figures below are an illustrative example with round numbers. They show steps 1 and 2.
Strong, weak and broken tick volume spikes
A strong reading passes all six checks and has a large candle body. The next candle does not undo the move.
A spike candle with long wicks on both sides that closes back inside the range is weak. It shows a fight, not agreement. A spike in thin holiday trading is also weak, because the average is so small that a modest burst makes the ratio look large.
A reading is broken when the next candle closes back across the level on similar or higher tick volume. The breakout failed, and the spike came from trapped traders, not new interest.
The bearish version is a close below a range low on a spike, which shows that sellers joined the move. The bullish version mirrors it: a close above a range high on a spike. When price keeps pushing while tick volume fades, that is a volume divergence, which has its own entry.
Common misread: high tick volume on a red candle does not mean sellers won. A long lower wick on heavy ticks can mean buyers absorbed the selling. Always read the close and the wick together with the count.
Testing the EURUSD 16 September 2026 breakdown against the checks
This is a past example on the EURUSD 1-hour chart, not a prediction. The candle at 16 September 2026, 21:00 (the price feed's chart time) is marked at 1.14701 and closed below the lowest low of the previous 20 candles. It printed 8,784 ticks. The 20 candles before it averaged 1,502.
The bars below show the gap. 8,784 ÷ 1,502 gives a ratio of 5.8, well past the 3x line at 4,506 ticks (3 × 1,502).
Steps 1 to 4 line up: the ratio is above 3x and the candle closed through a clear level. Step 6 points down, because the close sits below the 20-candle low.
Step 5 is still open. On many feeds, 21:00 chart time falls near the US close and the daily rollover, hours that are usually thin. The facts for this example do not include the 21:00 tick counts on earlier days, so you cannot clear step 5 from them. Before acting, you would check the 21:00 candles on the previous five days.
If 21:00 is busy every day on that feed, the 5.8x reading means less. If it is usually quiet, ask one more question: did the burst come from real orders, or from quotes flickering while spreads widen around rollover? Until you answer that, this is a promising reading, not a confirmed breakdown.
Two tick volume setups with entry, stop and target
Both setups are illustrative examples on the made-up range in the chart below, not real market data.
Selling a range breakdown on a 5x tick volume spike
The chart below shows a range. The second-to-last candle closes below the range floor on 7,500 ticks. That is about five times the average line.
- Entry: sell at the close of the spike candle.
- Stop loss: the spike candle's high is 24 pips above entry. Add a 4-pip buffer, so your risk is 28 pips.
- Target: twice the risk, 28 × 2 = 56 pips below entry.
- Size: on a $10,000 account risking 1%, you risk $100. One standard lot (100,000 units) of EURUSD is worth $10 per pip. $100 ÷ (28 × $10) = $100 ÷ $280, rounded down to 0.35 lots.
The last candle closes still below the floor, on 2,900 ticks. If it had closed back inside the range, the setup would be broken and you would exit.
Fading a poke above the range high on thin tick volume
The same range is 28 pips tall. Suppose price pokes 6 pips above the range high on tick volume below the average line. The next candle closes back inside the range, 5 pips below the range high.
- Entry: sell on that close, 5 pips below the range high.
- Stop loss: 5 pips above the poke high, which is 6 + 5 = 11 pips above the range high. Your risk is 5 + 11 = 16 pips.
- Target: the range floor, 28 − 5 = 23 pips below entry.
Skip the fade if the poke candle reached 2x the average or more. That breakout had real participation.
When tick volume helps and when to ignore it
Tick volume works best on liquid pairs during active sessions, at clear levels, and on timeframes where each candle collects many ticks. Ignore it around scheduled news, when almost every candle spikes. Ignore it too in thin holiday or rollover hours, on exotic pairs that tick rarely, and when comparing raw counts between brokers.
| Pros | Cons |
|---|---|
| Available on every forex chart and timeframe | Says nothing about order size |
| Shows quickly whether a breakout had participation | Counts differ between price feeds |
| Easy to turn into a ratio you can apply the same way every time | Spikes at session opens and news hours mean less |
| Works with any price level or pattern | Has no direction; you need the candle to read it |
Practical tips for reading tick volume
- Use one price feed for all your volume work. Different feeds count different ticks.
- Judge closed candles only. The live candle's count keeps growing until it closes, so it always looks low partway through.
- Compare ratios, not raw counts, across pairs or timeframes.
- After a long trend, a spike can mark exhaustion (a climax) rather than the start of a move. Wait for the next close before chasing it.
- On a pair that ticks rarely, move up one timeframe so each candle holds enough ticks.
- Write down the ratio and the same-hour result before you enter, so you can later review which readings held up.
Pre-trade tick volume checklist
- Ratio taken from closed candles and written down
- Same hour on the last five days checked
- Candle sits outside any news, holiday or rollover window
- Stop beyond the spike candle, with lots sized from that pip distance
FAQ
Does a tick volume spike on a news candle mean anything?
Very little on its own, because the release itself floods the quote feed. Judge the candles after it instead. If one of them closes beyond a clear level with tick volume still above average, the move has participation beyond the first reaction.
What lookback should I use instead of 20 candles on a 15-minute chart?
Twenty 15-minute candles cover only 5 hours (20 × 15 minutes), so the average can sit entirely inside one quiet or busy session. A lookback that spans a full day, 96 candles (24 hours × 4), gives a steadier average.
How is tick size different from tick volume?
Tick size is the smallest step an instrument's price can move, set by the exchange or broker. Tick volume counts how many times the price changed during a candle. Tick size describes how price moves, while tick volume measures how active the market was.