High volume node
Also called HVN, Volume node, High volume area
A high volume node (HVN) is a price level or narrow price zone where much more volume traded than at the prices around it. It shows as a thick bulge on a volume profile, and price often slows, stalls or turns when it comes back there.
A node marks a price where many traders already agreed to buy and sell, so many of them still hold positions there. That is why a node helps you plan where a trade may stall, where a stop could get hit, and where a breakout may run out of room.
How to spot a high volume node on a volume profile
A volume profile lays volume on its side. Normal volume bars show how much traded in each candle. A profile shows how much traded at each price across all the candles you choose. A high volume node is a bulge in that sideways histogram.
Spot forex has no central exchange. So most forex profiles use tick volume, the number of price changes, in place of traded contracts. The shape still shows where activity bunched up.
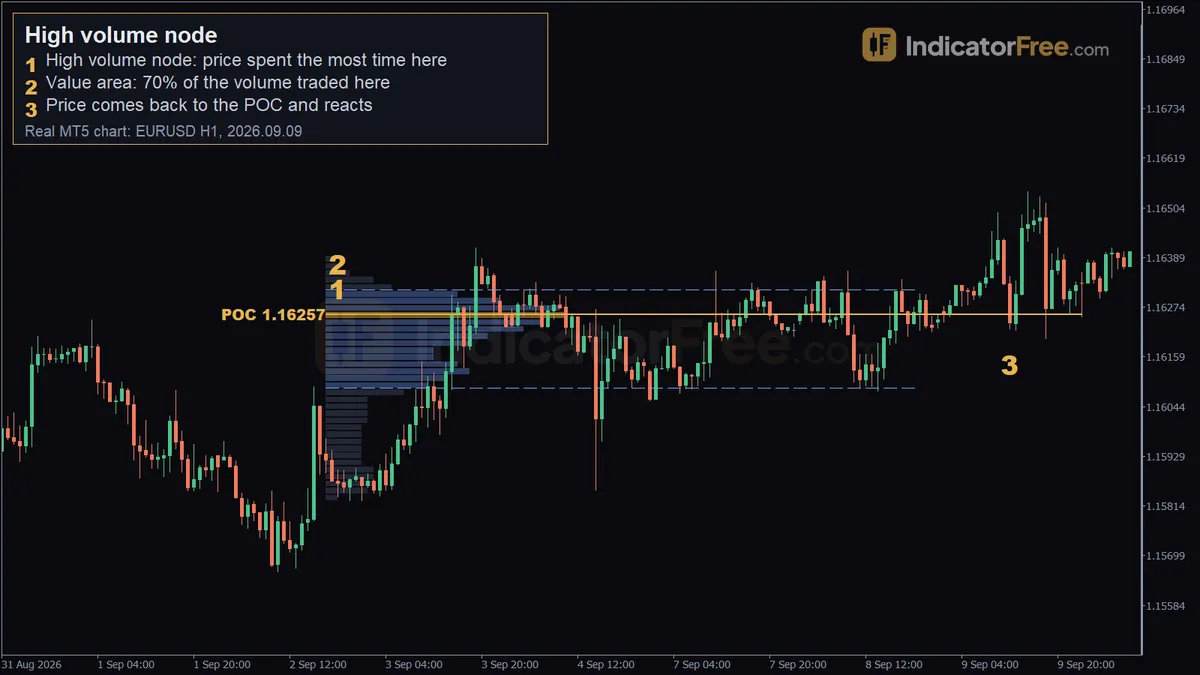
The drawing below shows what to look for: thick rows where price spent time, and thin rows where price moved quickly.
A low volume node is the opposite idea: the thin rows that price usually crosses quickly.
Use this checklist each time:
- Choose one clear block of candles: a session, a week, or a swing from one turning point to the next.
- Build the profile over that block only.
- Find rows that are clearly wider than the rows above and below them. One clear bulge counts for more than several medium ones.
- Mark the bulge as a zone, from its top row to its bottom row, not as one line. The widest row inside it is the point of control (POC).
- Check for thin rows on either side. A node only stands out if price moved quickly through the prices next to it.
- Note where price is now. If price is above the node, the node may act as support. If price is below it, the node may act as resistance. If price is inside it, you have no edge yet.
A high volume candle is not a high volume node
In trading, "high volume" just means more activity than usual. A tall volume bar under one candle tells you a lot happened in that time period. That could be one news spike that ran straight through 30 pips without any real agreement on price.
A node tells you a lot traded at the same prices, across many candles. That matters because traders who built positions there tend to defend them or get out when price returns.
To check: if most of the bulge comes from one or two candles, treat it as a spike, not a node.
What makes a node strong, weak or broken
A strong node formed over many candles of sideways trading. It has one clear peak, price left it decisively, and price has not come back to it yet.
A node is weak if the profile mixes a range and a trend, so several bulges compete. It is also weak if price has already tested it several times, or if it formed during quiet hours or one news burst.
A node is broken once price closes beyond the far side of the zone and keeps trading there. Here is a rule you can use: if two or more candles on your trading timeframe close beyond the zone, stop treating it as support or resistance. Wait to see whether it switches role on the next retest.
Reading the EURUSD 1-hour example at the top
The chart at the top is a past example, not a prediction.
Marker 1, the node. Over 100 one-hour candles, from 2026.09.02 18:00 to 2026.09.08 21:00, the most tick volume traded at 1.16257. That is the POC, the centre of the high volume node. On the chart, look for the thickest row of the profile.
Marker 2, the value area. 70% of the volume traded between 1.16086 and 1.16314. The POC sits near the top of that band. It is 5.7 pips below the value area high and 17.1 pips above the value area low.
Marker 3, the return. On 2026.09.09 12:00, price came back to the POC and the marker sits at 1.16224. That is 3.3 pips below the POC line. Price then moved 28 pips up. The lesson: the node is a zone. A stop placed right at the POC line would have been hit before the move.
The levels below put those four prices on one scale.
Trading the return to a high volume node
Buying the pullback into the 1.16257 node
The following plan is an illustrative example. It uses the real levels from the chart above with a $10,000 account that risks 1% per trade.
- Entry: buy at the POC, 1.16257. As a general rule, only take it if price reaches the node after moving away from it, and a 1-hour candle dips into the zone and closes back up. In this example we assume the trigger candle formed; the chart facts only record the return and the move that followed.
- Stop loss: 20 pips below the entry. The value area low of 1.16086 is 17.1 pips below the POC, so the stop sits 2.9 pips beyond the value area. The value area is used here as the outer edge of the zone, because the node's own rows are not given. That way, normal probing inside it, like the dip to 1.16224, does not stop you out.
- Target: the value area high, 1.16314, is only 5.7 pips away. That is less than a third of the 20-pip risk, so it cannot be the main target. Take part of the position off at 1R (20 pips above entry) and aim the rest at 2R (40 pips above entry). The 2R target is a risk multiple, not a structure level. In live trading you would first check for the next node above 1.16314.
The 28-pip rise from the return (about 25 pips above the 1.16257 entry) reached 1R but not 2R. A one-target plan at 2R would not have been filled on that move.
A rule to use: if your first target is closer than your stop, either tighten the stop to just beyond the node zone or skip the trade.
When high volume nodes work and when to skip them
Nodes work best in balanced, two-way markets. They also work on pullbacks inside a trend, when price returns to a node that the trend left behind. Use them during liquid hours, when enough orders are around to hold a level.
Skip them before high-impact news. Also skip them when price is trending hard and the node is far behind, or when the profile covers so few candles that every row looks alike.
| Pros | Cons | |
|---|---|---|
| Levels | Based on where trading actually happened, not on drawn lines | Node edges are fuzzy, so you need a buffer |
| Planning | Shows where a trade may stall before you enter | Price often pokes through the POC line before reacting |
| Flexibility | Works on any market and timeframe | The result changes with the candle range you choose |
| Forex data | Tick volume still shows where activity clustered | Tick volume counts price changes, not real traded size |
Practical tips for trading high volume nodes
- Draw the node as a zone with a top and a bottom, and place stops beyond the zone, never on the POC line.
- Wait for a reaction candle in the zone before entering. Price touching the node is not a signal on its own.
- Measure the distance to the next node or low volume area before you enter. That gap is your realistic room to profit.
- Count each retest. Each retest uses up resting orders, so treat a node that has held several times with more caution.
Quick high volume node checklist
- One clear bulge, built over many candles, not one spike.
- Price is outside the node and returning to it, not stuck inside.
- Stop is beyond the zone. First target is at least as far as the stop.
- No high-impact news due during the trade.
FAQ
Do I need a special indicator to find high volume nodes?
You need a volume profile tool, and most charting platforms offer a session or fixed-range version. Without one, the zone where price spent the most candles moving sideways is a rough stand-in.
Where should I start and end the profile?
Avoid cutting the range in the middle of a move. That creates fake bulges at the edges of the profile.
Which timeframe gives the most useful nodes?
Nodes from daily or weekly profiles carry the most weight. Many traders find those first, then time entries with 1-hour or 4-hour candles inside them.