









Value area
Also called VA, Value area high and low, VAH and VAL, 70% value area
The value area is the price range where about 70% of a period's volume traded. Its top is the value area high (VAH), its bottom is the value area low (VAL), and the point of control (POC) sits inside it.
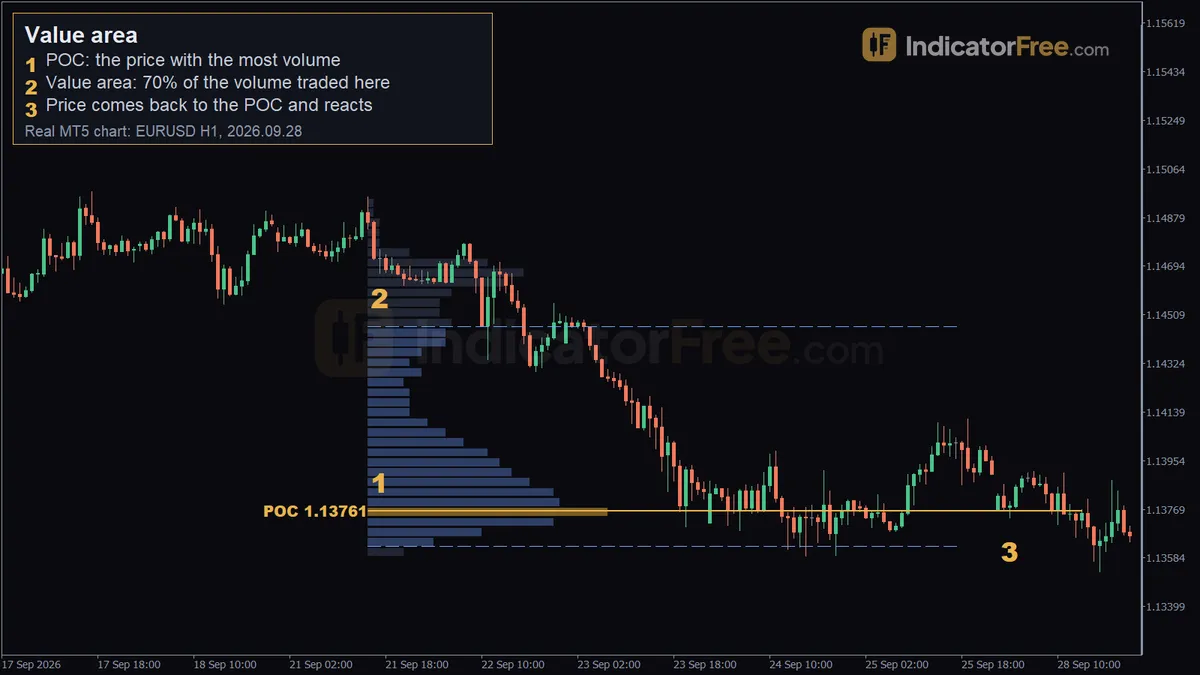
The value area shows you which prices the market treated as fair. Inside that zone, price tends to move back and forth. Outside it, price either gets pushed back in or starts building a new zone at a new level. Telling those two apart tells you whether to fade a move or go with it. To fade means to trade against the move, betting that price will return inside the value area.
How to mark a value area, step by step
You build a value area from a volume profile. This is a sideways histogram that shows how much volume traded at each price over a chosen period. Spot forex has no central exchange, so the profile uses tick volume instead: the number of price changes, which stands in for the real traded size.
- Choose one period that belongs together: a session, a day, a week or a sideways range. The chart at the top of the page uses 100 one-hour candles.
- Split the price range into equal rows and add up the volume in each row.
- Find the row with the most volume. That row is the point of control (POC).
- Starting from the POC, compare the two rows just above it with the two rows just below it. Add whichever pair has more volume.
- Repeat until the rows you have added hold at least 70% of the period's volume.
- The top of that block is the value area high (VAH). The bottom is the value area low (VAL).
The profile below shows ten rows from one session. The gold rows form the value area, the green row is the POC and the grey rows are outside value.
Here are the same ten rows worked through as numbers. This is an illustrative example of how the 70% block grows out from the POC:
Look at the result: you reached 84.5% (7,100 ÷ 8,400), not 70%, because each step adds two rows at once. At 5,700 you needed 180 more, and the next pair added 1,400. Thinner rows mean smaller steps, so the edge lands closer to 70%.
Valid, weak and broken value areas
A value area is valid when buyers and sellers were both active during the period. Price moved up and down within a range, the profile has a bell shape with one clear POC, and the period is long enough to count: at least one full session. Value areas are most useful in the session right after a balanced period, and on busy pairs where tick volume is steady.
It is weak in five cases:
- Trend day: volume is spread along one long move, so the profile has no clear bulge and no clear POC. The 70% edges then mark prices that nobody defended, so they mean little.
- Two POCs: the profile has two peaks of similar size. That usually means two separate ranges, so split the period in two.
- News spike: one burst of volume from a single event dominates the profile.
- Old value area: price has since moved far away from it.
- Thin holiday hours: tick volume is low, so a handful of price changes shape the whole profile.
It is broken when price is accepted outside it. A quick move past the VAH or VAL that closes back inside is a rejection, not a break. A break looks different: price closes outside for several candles, then comes back to the edge and holds it from the other side. That means the market has moved value somewhere else.
A decision rule you can use: if price closes back inside within one or two candles, treat the edge as intact. If price holds outside for two closes and then a retest of the edge holds, treat the value area as broken. Stop fading that edge and trade in the direction of the break.
Reading the EURUSD 1-hour value area at the top of the page
The chart at the top is a past example, not a prediction. It covers 100 one-hour EURUSD candles, from 2026.09.21 15:00 to 2026.09.25 18:00.
- Marker 1, POC at 1.13761. More tick volume traded at this price than at any other price in those 100 candles. The label sits at 2026.09.21 17:00, near the start of the range, but the level applies to the whole period.
- Marker 2, value area up to 1.14463. 70% of the volume traded between 1.13628 (VAL) and 1.14463 (VAH), a range 83.5 pips wide.
- Marker 3, return to the POC at 1.13736. On 2026.09.28 02:00, price came back down to the POC and then moved 15 pips up.
The shape of the profile tells you more than the three levels. The POC is only 13.3 pips above the VAL (1.13761 − 1.13628) but 70.2 pips below the VAH (1.14463 − 1.13761). So most of the trading happened near the bottom of the range, and the upper part saw much less. When price came back days later, buyers stepped in at that heavy zone near the POC.
A common mistake is to assume that once price reacts at the POC, it must run to the VAH. The record for this example shows only a 15-pip move. Plan your target, but don't count on it being reached.
Compare today's value area with yesterday's to pick fade or follow
Put each day's value area next to the one before it. There are three possible outcomes:
- Overlapping: today's value area shares much of its range with yesterday's. The market is balanced, so fading the edges makes sense.
- Higher (bullish): today's value area sits clearly above yesterday's. Value is moving up, so following upside moves makes more sense than selling the VAH.
- Lower (bearish): today's value area sits clearly below yesterday's. Value is moving down, so following downside moves makes more sense than buying the VAL.
The picture below shows the first two cases side by side.
Also watch where price opens. An open inside the previous value area points to price moving back and forth. An open outside means you should watch the first hour to see whether price is accepted out there or rejected.
Three ways to trade the value area
Buying a return to the POC
Use when today's value area overlaps yesterday's and price is trading inside value.
- Entry: near 1.13761, after price trades into the POC and a 1-hour candle closes back above it. In the example, the dip reached 1.13736.
- Stop loss: below the VAL at 1.13628, with a small buffer. If price falls through the bottom of the value area, the idea that buyers will defend it is wrong.
- Target: the VAH at 1.14463. Take part of the position off once the trade is in profit by the same distance as your stop.
Here is the position size, as an illustrative example: a $10,000 account risking 1%, with the stop 3 pips below the VAL.
- Stop distance: 13.3 pips from the POC to the VAL (1.13761 − 1.13628), plus the 3-pip buffer = 16.3 pips.
- Money at risk: $10,000 × 1% = $100.
- One standard lot (100,000 units) of EURUSD is worth $10 per pip, so $100 ÷ (16.3 × $10) = 0.61 lots, rounded down.
- Distance to the target: 1.14463 − 1.13761 = 70.2 pips, about 4.3 times the risk.
Fading a failed break of the VAH or VAL
Use when today's value area overlaps yesterday's and price pokes past an edge.
- Entry: on the close that marks a rejection under the decision rule above. In the example, a dip below 1.13628 that closed back inside would be a buy.
- Stop loss: just beyond the furthest point price reached outside.
- Target: the POC first (1.13761), then the opposite edge (1.14463).
The logic: traders who pushed price outside value got no follow-through, so price often moves back across the value area.
Following acceptance outside value
Use when today's value area sits clearly above or below yesterday's.
- Entry: once the value area counts as broken under the decision rule above, enter on the retest that holds. In the example, you would buy if price held 1.14463 from above.
- Stop loss: a few pips back inside the value area. If price gets back in and stays there, the breakout has failed.
- Target: add the value area width to the edge: 1.14463 plus 83.5 pips. Use it as a reference level, not a fixed goal.
Quick value area checklist
- Was the period balanced, with one clear POC?
- Are the VAH, POC and VAL taken from the latest completed period?
- Is price inside value (expect it to move back and forth) or outside (wait for acceptance or rejection)?
- Is the stop beyond the edge, the target at the POC or the opposite edge, and the size set from the stop distance?
FAQ
Why do traders use 70% for the value area?
On a bell-shaped profile, about 68% of the volume falls within one standard deviation of the middle. Traders rounded that to 70%. It is a convention, not a law. Some traders use 68%. Whatever number you pick, keep using the same one so your zones can be compared.
Which period should I build the value area on?
Use the period that matches how long you hold trades. Day traders usually use the previous day or session. Swing traders often use the previous week. Candle size inside the period only sets the detail: 1-hour candles work for a week, and 5-minute candles suit a single day.
Will my value area match another trader's?
Not exactly. Tick volume depends on each broker's price feed, so the POC and edges can differ by a few pips between platforms. Treat each level as a narrow zone, not a single exact price.