









volume profile poc
Also called POC, point of control, VPOC, volume POC, volume point of control
The volume profile POC (point of control) is the single price level where the most volume traded over the range you selected. It shows the price the market accepted most, and traders use it as a reference level for reactions and targets.
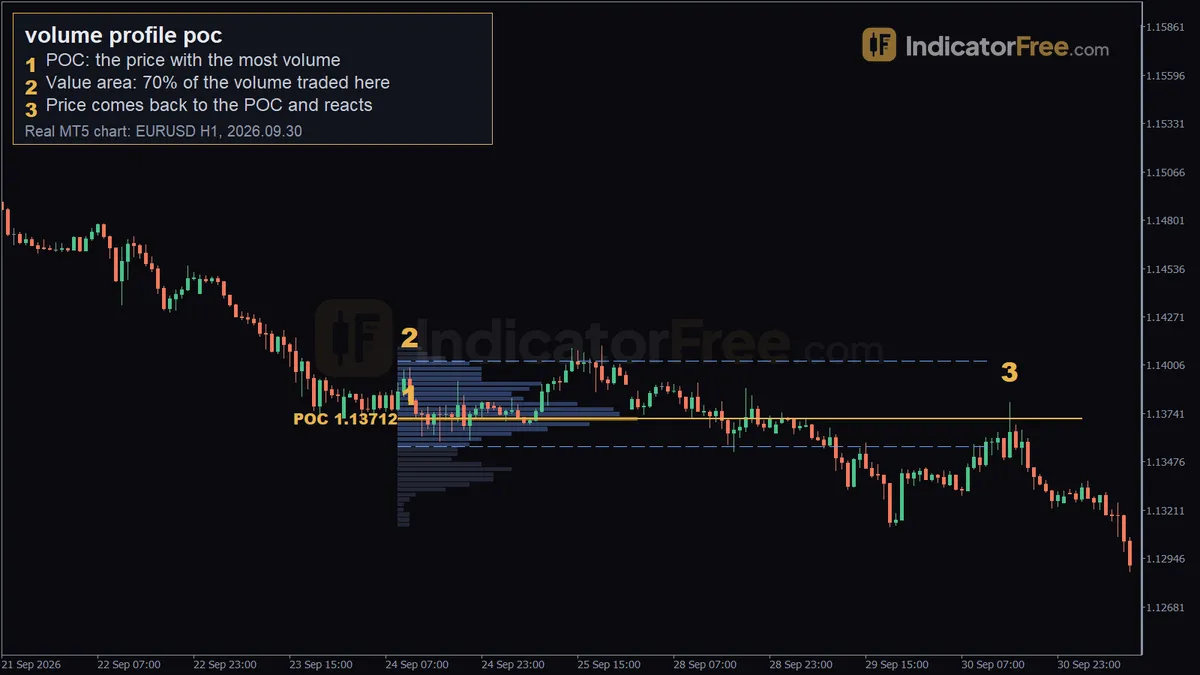
The POC is not a classic support or resistance line. It marks where buyers and sellers agreed most, so price can chop straight through it as easily as bounce off it. Knowing which of the two to expect is what keeps you from placing a stop in the busiest part of the chart.
What the POC and the value area show on a profile
A volume profile turns volume sideways. Instead of one bar per candle under the chart, it draws one bar per price row, so you see how much traded at each price.
Three parts matter:
- POC (point of control): the longest bar, the one price row with the most volume.
- Value area: the band of prices around the POC that holds 70% of the volume. Its top is the value area high, its bottom the value area low.
- Thin rows: short bars outside the value area, where price passed quickly and little traded.
In the EURUSD 1-hour example at the top of the page, the profile covers 100 candles from 24 September 2026 09:00 to 30 September 2026 12:00. The POC sits at 1.13712, and 70% of the volume traded between 1.13560 and 1.14029. The drawing below shows how those three prices sit on the profile.
The POC is the most traded price, not the average price. Here it is 15.2 pips above the value area low and 31.7 pips below the value area high. A lopsided profile like this is normal, so never assume the POC is the midpoint of the range.
One more point for spot forex: there is no central exchange counting every contract. The example uses tick volume, which counts how many times the price changed. The POC is then the price with the most activity, not a count of money traded.
The inputs that move the POC
The POC is a result of your settings. Change the settings and the line moves, sometimes by many pips.
| Input | What it controls | What changing it does |
|---|---|---|
| Range (start and end) | Which candles are counted | A longer range gives a slower POC that reflects older trading. A shorter one tracks recent trading and shifts more often. |
| Row size (or number of rows) | How fine each price row is | Fine rows give a precise but jumpy POC. Coarse rows give a steadier POC that is really a small zone. |
| Value area percentage | How much volume the value area holds | A higher figure widens the band. It does not move the POC. |
| Volume source | Tick volume or real volume | Spot forex usually offers tick volume only. Futures offer real volume. |
Defaults differ from one volume profile tool to the next, so none are quoted here. The names above are the same on most charting platforms, which makes it easy to match your settings to the ones another trader describes.
Signals the POC gives
Price returns to the POC and reacts
After price has left the value area, a return to the POC is a test of the old agreed price. A rejection candle there says the market no longer accepts that price. This is the signal shown in the example chart.
Price holds on one side of the POC
Use this as a bias rule. If candles close above the POC and pullbacks stop at it, favour longs toward the value area high. If candles close below it, favour shorts toward the value area low.
The POC migrates
A developing POC is the POC of a range that is still open, so it can jump as new volume arrives. When it steps higher across the session, the market is building value at higher prices. When it stays flat while price pushes away, the move has little volume behind it yet.
An untested POC acts as a target
A POC from an earlier session that price has not revisited is often called a naked POC. Traders treat it as a level price may revisit, so they use it as a take-profit level rather than as an entry. The rule is simple: once price touches it, it is no longer naked and you drop it as a target.
When the POC helps and when to leave it alone
It tends to work well when:
- price has clearly left the value area and comes back to the POC for the first time;
- the profile has one clear peak, so the POC is obvious;
- the range you profiled ends at a natural break, such as a session or week close;
- you use it as a target for a trade taken at the edge of the value area.
Avoid relying on it when:
- price has crossed the POC several times in the last few candles (it is then the middle of a range, not a level);
- the profile is flat or has two similar peaks;
- a strong one-way trend is running and the profile is stretched thin;
- a major news release is due, because it can redraw the profile in minutes.
Pros and cons of trading the POC
| Pros | Cons |
|---|---|
| Based on where trading happened, not on a formula of closing prices | Shows how much traded at a price, not whether buyers or sellers were the aggressive side |
| Completed profiles do not change afterwards | Waiting for a candle close to confirm a reaction gives a later, worse entry price |
| Pairs naturally with the value area for stop and target placement | Gives no time element: an old POC and a fresh one look the same on the chart |
A POC retest setup on the EURUSD 1-hour example
Fading the first return to the POC
This is a past example, not a prediction. The profile range ended on 30 September 2026 at 12:00. Three hours later, at 15:00, price came back to the POC at 1.13712. The retest marker on the chart sits at 1.13803, and price then moved 49 pips down. The marker is drawn above the POC line, not on it, which is why the stop in this plan goes above the marker.
Here is how a trader could frame that as a plan, using only the levels on the chart:
- Entry trigger: price reaches the POC at 1.13712 and a 1-hour candle closes back below it. A touch alone is not a trigger.
- Stop loss: above the retest marker at 1.13803. That is 9.1 pips from the POC, before any buffer for spread.
- Exit: the value area low at 1.13560, which is 15.2 pips below the POC.
Check the reward against the risk before you take a trade like this. Measured at the POC itself, it is 15.2 pips to the target against 9.1 pips to the stop, about 1.7 to 1. That is the best case. A candle that closes below 1.13712 fills you lower, so your stop is larger and your target smaller. Measure both distances from your actual fill; if the close leaves less reward than risk, skip it. Had the stop gone above the value area high instead, the risk would be 31.7 pips for the same 15.2-pip target, which is a poor trade.
The drop in this example carried well past the value area low at 1.13560. That is why some traders close part of the position at the value area low and trail the rest.
Sizing the trade from the stop distance
The figures here are an illustrative example. The 9.1-pip stop above plus a small spread buffer is roughly 10 pips, so use a 10-pip stop. You have a $5,000 account and you risk 1% per trade. A standard lot of 100,000 units on a USD-quoted pair is worth $10 per pip.
POC stops are often tight, and tight stops produce large lot sizes. Recalculate the size for every trade.
Choosing the profile range for your trading style
| Style | Range to profile | Chart timeframe | How the POC is used |
|---|---|---|---|
| Scalping | The current session, still developing | 1-minute to 5-minute | Intraday fair price to trade back toward |
| Day trading | Yesterday's completed session, plus today's | 15-minute to 1-hour | Reference level at the open and first target |
| Swing trading | The previous week, or a fixed range over the last swing | 4-hour to daily | Zone for entries and profit targets |
Gold covers far more price distance in a session than a major FX pair. Use a larger row size on gold, or the profile breaks into many thin rows and the POC jumps between them. On major pairs a finer row size keeps the POC precise.
Pairing the POC with VWAP
VWAP is the volume-weighted average price of a period. The POC is the most traded price. Put both on the chart and check where VWAP sits before you take a POC retest:
- If VWAP sits within one profile row of the POC, treat the two as one zone and take the trade only after a candle closes away from both.
- If VWAP sits between the POC and your target, make VWAP the first exit and the value area edge the second.
- If VWAP sits on the stop side of the POC, place the stop beyond VWAP as well. If that makes the risk larger than the reward, skip the trade.
Practical tips and a quick checklist
- Draw the POC as a zone one row wide, not as a single price.
- Write the range you profiled next to the level, so you can redraw the same profile later.
- Prefer completed profiles for levels and the developing profile for bias.
- Treat the first return to a POC differently from later ones. Each revisit adds volume there and makes a clean reaction less likely.
- Set the target before the entry. If the value area edge is closer than your stop distance, skip the trade.
Quick checklist:
- Is the profile range complete and written down?
- Has price left the value area and returned to the POC for the first time?
- Did a candle close back away from the POC?
- Is the target at least as far as the stop?
- Is the lot size recalculated for this stop?
Not to be confused with the market profile POC
A market profile counts time: how many time periods price spent at each level. Its POC is the price where the market spent the longest. A volume profile counts volume, so its POC is the price where the most traded. The two often sit close together, but they separate when a lot of volume trades in a short burst.
FAQ
Why is the POC on my chart different from another trader's on the same pair?
Spot forex tick volume comes from your own broker's price feed, so two feeds count different ticks. Expect small differences even with identical settings, and treat another trader's POC as an area to check on your own chart.
What do I do when the profile shows two big peaks?
By definition only the longest bar is the POC. The second peak is a high volume node, and the thin area between the two is where price tends to move fast. Many traders split the range and profile each peak on its own.
Does the POC work on a 5-minute chart?
The calculation is the same on every timeframe, so the level is drawn the same way. What changes is the cost. The distances between the POC and the value area edges shrink, so the spread takes a bigger share of each target. Compare your spread with the distance to the target before you trade it.