









Volume profile
Also called VP, Volume at price, Volume by price
Volume profile is a chart indicator that shows how much volume traded at each price over a chosen period. It draws this as a sideways histogram, so you can see which prices the market accepted and which ones it moved through quickly.
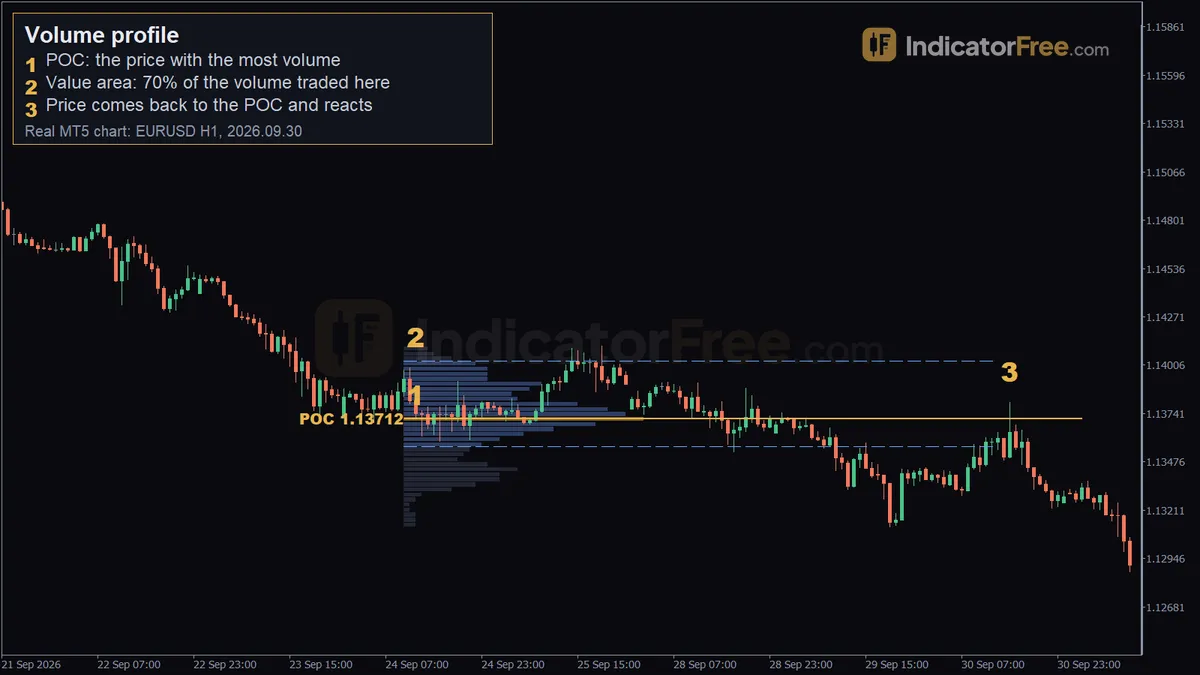
Volume profile changes where you put your orders. It helps you avoid two mistakes: putting a stop on a level that price keeps returning to, and buying a breakout just below a heavy block of earlier trades.
Reading a volume profile: POC, value area and volume nodes
A volume profile is a stack of horizontal bars. Each bar is one price row. Its length shows how much volume traded at that row during the range you selected. Long bars mean the market traded heavily there. Short bars mean it passed through quickly.
The diagram below labels the parts you read on every profile.
- Point of control (POC): the single price row with the most volume. It is the price the market treated as most "fair" in that range.
- Value area: the band around the POC that holds a set share of all volume, usually 70%. Its top is the value area high (VAH) and its bottom is the value area low (VAL).
- High-volume node (HVN): a thick cluster of long bars. Price tends to slow down and move back and forth there.
- Low-volume node (LVN): a thin gap of short bars. Price tends to cross it quickly because few positions were built there.
The chart at the top of this page is a past EURUSD 1-hour example, not a prediction: its three markers show the POC, the value area and price returning to the POC.
What volume means on a forex volume profile
In trading, volume is the amount traded in a period. On a stock or futures exchange, that is the real number of shares or contracts. Spot forex has no central exchange, so nobody sees the whole market's volume.
Forex charts therefore use tick volume: the number of price changes your data feed recorded. More ticks usually means more activity, so tick volume works as a stand-in for real volume. It is still only your feed's count. Two data feeds can draw slightly different profiles and put the POC a few pips apart.
The practical rule: treat a forex POC or VAH as a zone a few pips wide, not an exact price. If your plan only works when price hits 1.13712 exactly, it is too precise for the data behind it.
Volume profile settings and what they change
Different versions use different names for their inputs. Almost every volume profile still has the same core settings. Defaults vary by version, so check the ones in the version you use.
| Input | What changing it does |
|---|---|
| Range (number of bars, session, or anchor point) | Sets which candles feed the profile. A longer range gives slower-moving, more important levels. A shorter one reacts faster but shifts often. |
| Row size / number of rows | Sets how many price rows the range is split into. More, thinner rows show finer detail but noisier nodes. Fewer, thicker rows merge nearby levels. |
| Value area % | Sets how much volume the value area must hold. 70% is the common choice and the one used in the example above. A higher number widens the band. |
| Volume source | Tick volume on forex. Real volume where the market reports it. |
| Up/down split | Some versions color each row by volume on rising versus falling candles. This shows which side was more active at a level. |
The range type matters more than any other input. A fixed range profile covers the bars you select. A session profile builds a new histogram for each day or trading session. An anchored volume profile starts from one candle you pick, such as a swing low or a news spike, and adds each new bar as it forms. Anchoring to the start of a move shows where traders built positions since that event. A session profile would split those positions across several days.
Signals volume profile gives
Return to the point of control
When price leaves the POC and later comes back, watch how it reacts. A candle that tests the POC and closes away from it suggests the old fair price is acting as a turning point. If price sits on the POC for several candles without reacting, the market is balanced. That is not a trade.
Rejection or acceptance at the value area edge
This is the most useful decision rule on the profile. If price pokes outside the VAH or VAL and closes back inside, the market rejected the new prices. Look for a move back toward the POC. If two or more candles close outside the value area and price stays there, the market accepted the new prices. The old value area no longer holds the action, and the next HVN beyond it becomes the next target.
The chart below uses illustrative levels to show a rejection: a wick above the VAH, a close back inside, then a drift back to the POC.
A common misread is treating the first touch of the VAH as a sell signal. A touch is not a rejection. Wait for the candle to close.
Low-volume node: the fast lane
Price that enters an LVN tends to cross it quickly to the next HVN. Do not set a limit order inside an LVN and expect a bounce.
Value area moving up or down
Compare today's value area with yesterday's. If the new one sits higher and barely overlaps, buyers are pushing value up. If it sits lower, sellers are pushing it down. Heavy overlap means a range. This trend read comes from where trading happened, not only from closing prices.
When volume profile works and when to skip it
Works well:
- In ranges and slow trends, where price moves back and forth between the VAH, POC and VAL.
- During liquid hours, when tick counts reflect many traders.
- When the profile range matches how long you hold trades (one day's profile for day trades, a week or more for swing trades).
- On levels that line up with an older swing high or low.
Avoid it or trade smaller:
- Just before and after major news, when price can jump straight through every node.
- In thin hours, when a few ticks can create a misleading POC.
- On a profile built from too few candles. A handful of bars cannot show where trading really concentrated.
- When you have no stop plan for the case where price is accepted outside the value area.
Volume profile pros and cons
| Pros | Cons |
|---|---|
| Finds levels from where trading happened, not only from swing points | The forex version runs on tick volume, a stand-in for true volume |
| Gives clear reference levels: POC, VAH, VAL | Levels depend on the range you choose. Change the range and they move |
| Works on any market and timeframe | Shows no levels above or below the range's extremes, so it gives no map in new price territory |
| LVNs help you keep stops out of fast-move zones | Gives no timing on its own. You still need a trigger candle |
| Value area shifts give a simple trend read | Clutters the chart if you stack many profiles |
Trading a POC retest: the EURUSD example
Selling the return to the POC on EURUSD 1-hour
This walk-through uses the top chart as a past example. It does not show what will happen next time.
- Context: the tick-volume profile of the 100 candles from 2026.09.24 10:00 to 2026.09.30 13:00 set the POC at 1.13712, the VAH at 1.14029 and the VAL at 1.13560. Price had moved away from the POC and then came back to it.
- Entry trigger: on 2026.09.30 15:00, price came back to the POC area and reacted lower. The chart marks that reaction at 1.13803, 9.1 pips above the POC, so this example enters there rather than at an idealised fill on the POC itself. The trigger is a 1-hour candle that tests the POC zone and closes lower, not the touch itself.
- Stop loss: above the VAH at 1.14029. From the entry that is 1.14029 − 1.13803 = 0.00226, or 22.6 pips. A tighter option is a few pips above the high of the rejection candle.
- Exit: the first target is the VAL at 1.13560. That is 1.13803 − 1.13560 = 0.00243, or 24.3 pips, below the entry. The 49-pip drop that followed took price below the VAL.
Check reward against risk before you enter. Here the first target (24.3 pips) is slightly larger than the risk (22.6 pips), so the trade passes. The decision rule: if the VAL is closer than your stop, use the tighter stop above the rejection candle or skip the trade. If you take it, close part of the position at the VAL and trail your stop on the rest.
Here is how to size this trade, as an illustrative example. The account is $10,000 and you risk 1% per trade. The 22.6-pip stop is rounded up to 23 pips. One standard lot (100,000 units) of EURUSD is worth $10 per pip.
Choosing volume profile settings for your trading style
| Style | Chart you trade | Profile range | Row size |
|---|---|---|---|
| Scalper | 1-minute to 5-minute | Current session, plus the prior session's POC | Thin rows for detail |
| Day trader | 5-minute to 15-minute | Prior day and current day | Medium |
| Swing trader | 1-hour to 4-hour | 100 or more candles, or anchored to the last major swing | Thicker rows |
| Position trader | Daily | Several months, anchored to a major turn | Thick rows |
Gold usually covers a much wider price range in a day than major FX pairs, so give gold a wider row size in price terms. If you copy a major-pair row size onto gold, the profile splits into many thin rows and the nodes become hard to read.
Pairing volume profile with market structure
Volume profile shows where price may react. Market structure shows which way the market is moving. Market structure is the sequence of swing highs and lows: higher highs and higher lows in an uptrend, lower highs and lower lows in a downtrend. A structure break is a close beyond the last swing high or low.
Use a simple filter: only take POC or value-area-edge trades in the direction of the latest structure break on your trading timeframe. If the last break was down, favor sells at the VAH or POC and ignore buy signals at the VAL. If structure and the profile disagree, stay out. This filter removes many trades against a strong move.
Practical tips for trading volume profile
- Read levels from a range that has finished. The POC of a closed range stays fixed, while the POC of a range that is still forming can keep moving.
- Mark the prior session's POC. Traders often watch an old POC that price has not revisited, called a "naked" POC, as a target when price drifts back toward it.
- Place stops beyond the next HVN. Never inside an LVN, where price runs fast.
- Re-anchor the profile after a news spike. The old profile describes trading from before the news, which may no longer apply.
Quick checklist
- The profile range matches how long I hold trades, and the range has finished.
- Price is at the POC, VAH, VAL or an LVN edge, and the candle has closed.
- I have identified rejection or acceptance, and market structure agrees.
- The first target is at least as far as my stop.
Not to be confused with market profile
Market profile, also called a TPO chart, measures time instead of volume. It counts how many time periods, often 30 minutes each, price traded at each level, and marks each period with a letter. Both tools give a POC and a value area, but the levels can differ. Price can spend a long time at a level where little volume traded. If someone's levels do not match yours, check which of the two they used.
FAQ
Which volume profile range should I use on a 15-minute chart?
Use the prior day's profile as your main map and watch the current day's profile as it builds. Early in the session the current profile holds only a few candles, so lean on the prior day's POC, VAH and VAL until the new one has filled out.
Does a naked POC always get revisited?
No. A naked POC is a level traders watch, not a promise. When a trend keeps running, price can leave an old POC untouched for a long time. Treat it as a target only when market structure already points toward it.