









Risk-reward ratio
Also called RR, R:R, risk/reward ratio, risk to reward ratio, reward-to-risk ratio
The risk-reward ratio compares what you can lose on a trade (entry to stop loss) with what you aim to gain (entry to take profit). At 1:2 you risk 1 unit to aim for 2.
The ratio does not tell you whether a trade is good. It tells you how many losing trades one winner pays for, and so how often you must be right just to stay level. At 1:2 one winner pays for two losers.
The risk-reward formula for a buy and a sell
Buy:   risk = entry − stop loss      reward = take profit − entry
Sell:  risk = stop loss − entry      reward = entry − take profit

Ratio = reward ÷ risk
(how many units you aim to gain for each unit risked)
Measure both distances in pips or both in money. The result is the same.
Traders call the risk amount R. A 1:2 trade risks 1R to aim for 2R, and a 1:3 trade aims for 3R.
Use the ratio as a check on your own results. At 1:2 you need more than 4 winners in 12 trades; count your last 12. If your journal shows fewer winners than the break-even number for your ratio, the ratio or the method has to change. The quick-reference table further down gives that number for other ratios.
One common misread: some traders write the reward first, so "2:1" and "1:2" can describe the same trade. To check, ask which number belongs to the stop loss.
A 1:2 trade measured on a EURUSD 1-hour chart
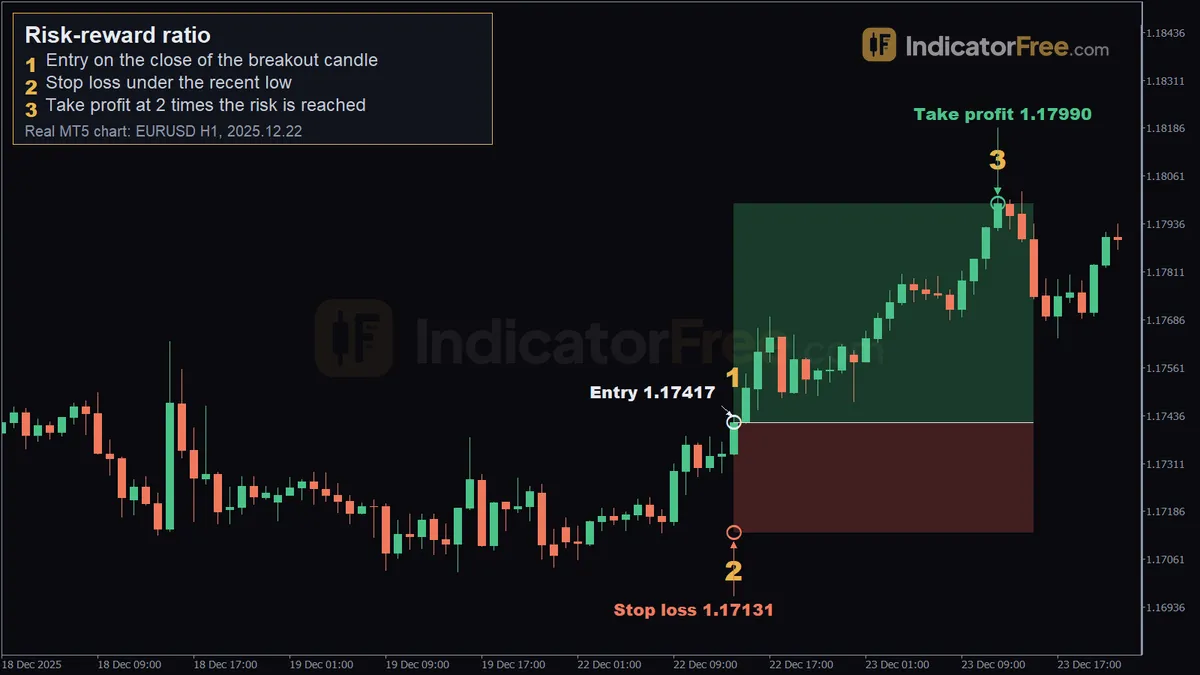
The chart at the top of the page is a past example, not a prediction. On it, marker 1 is the entry on the close of the breakout candle, marker 2 is the stop loss under the recent low, and marker 3 is where the take profit at 2 times the risk is reached. It shows a buy at 1.17417 on 22 December 2025 at 14:00, with the stop loss under the recent low at 1.17131 and the take profit at 1.17990.
- Risk: 1.17417 − 1.17131 = 0.00286, about 29 pips.
- Reward: 1.17990 − 1.17417 = 0.00573, about 57 pips.
- 57 ÷ 29 is about 2, so the trade is 1:2.
Price reached the take profit on 23 December 2025 at 12:00. The order of the decisions matters: the stop came first, from the chart, and the target was then set at twice that distance. The figure below shades the reward so you can compare it with the risk distance under the entry.
Risk and reward in dollars on $500, $5,000 and $50,000 accounts
The figures here are an illustrative example. You risk 1% of the account, with a 25-pip stop and a 50-pip target, on a USD-quoted pair where one standard lot (100,000 units) moves $10 per pip.
- Risk in money = account × 1%.
- Money per pip = risk in money ÷ stop in pips.
- Lots = money per pip ÷ $10.
- Reward in money = target in pips × money per pip.
The figure below runs the four steps for the $5,000 account.
| Account | 1% risk | Money per pip | Lots | Loss at stop | Gain at target |
|---|---|---|---|---|---|
| $500 | $5 | $0.20 | 0.02 | $5 | $10 |
| $5,000 | $50 | $2 | 0.20 | $50 | $100 |
| $50,000 | $500 | $20 | 2.00 | $500 | $1,000 |
The ratio is 1:2 on every row. Account size changes the lot size, never the ratio.
Trading costs do change it. The cost is paid whether you win or lose, so it is added to the loss and taken out of the gain. If spread and commission cost 1 pip in this example, your real risk is 26 pips and your real reward is 49. That is 49 ÷ 26 = 1.88, so the trade is closer to 1:1.9 than 1:2.
The shorter the stop, the larger this effect. Put the same 1 pip on a 10-pip stop with a 20-pip target: the risk becomes 11 pips and the reward 19. That is 19 ÷ 11 = 1.73, about 1:1.7.
Quick reference: what 1:1, 1:2 and 1:3 ask of you
No ratio is best on its own. A wider target is hit less often, so a higher ratio trades frequent small wins for rare larger ones. The table uses the same 25-pip stop and $50 risk, and shows how many winners you need in 12 trades to break even before costs.
| Ratio | Target for a 25-pip stop | Reward on $50 risk | Wins needed in 12 trades to break even |
|---|---|---|---|
| 1:0.5 | 12.5 pips | $25 | 8 |
| 1:1 | 25 pips | $50 | 6 |
| 1:2 | 50 pips | $100 | 4 |
| 1:3 | 75 pips | $150 | 3 |
| 1:5 | 125 pips | $250 | 2 |
The bars below show that last column. Each step up in ratio lowers the number of winners you need, but the drop gets smaller each time.
To redo the last column yourself: 12 ÷ (1 + ratio), where ratio = reward ÷ risk. For 1:2 that is 12 ÷ (1 + 2) = 4.
A good ratio is one your own trade records can support.
Risk-reward mistakes that quietly change your ratio
- Tightening the stop to make the ratio look better. The stop belongs where the trade idea is wrong, such as beyond a recent low. A stop inside normal price noise gets hit more often.
- Picking a target the chart does not offer. If support or resistance sits between entry and target, measure to that level instead. If the ratio then falls below your minimum, skip the trade.
- Moving the stop further away after entry. The risk grows while the target stays where it was, so the ratio you planned is gone. A 1:2 plan with the stop moved to twice the distance has become 1:1.
- Measuring from the price you wanted, not the price you got. If a buy fills higher than planned, the stop is further away and the target is closer. Recalculate from the actual fill price before you leave the trade running.
FAQ
What risk-reward ratio should a beginner start with?
Start from the stop, not from a ratio. Place the stop where the chart says the idea is wrong, measure to the nearest level price would have to pass, and work out the ratio that gives you. Then look up its break-even number in the table above: if your last 12 trades at that ratio show more winners than that number, keep it. If they show fewer, take only setups that offer a higher ratio, or skip the trade.
Does the risk-reward ratio change after I enter the trade?
The planned ratio does not, but the result can. If you plan 1:2 and close by hand at half the target, you realized 1:1. Record the realized R for each trade, because that number, not the plan, decides your break-even point.