









Breakout & session indicators
- Indicators
- 3
- Expert Advisors
- 0
- Downloads
- 5
3 tools
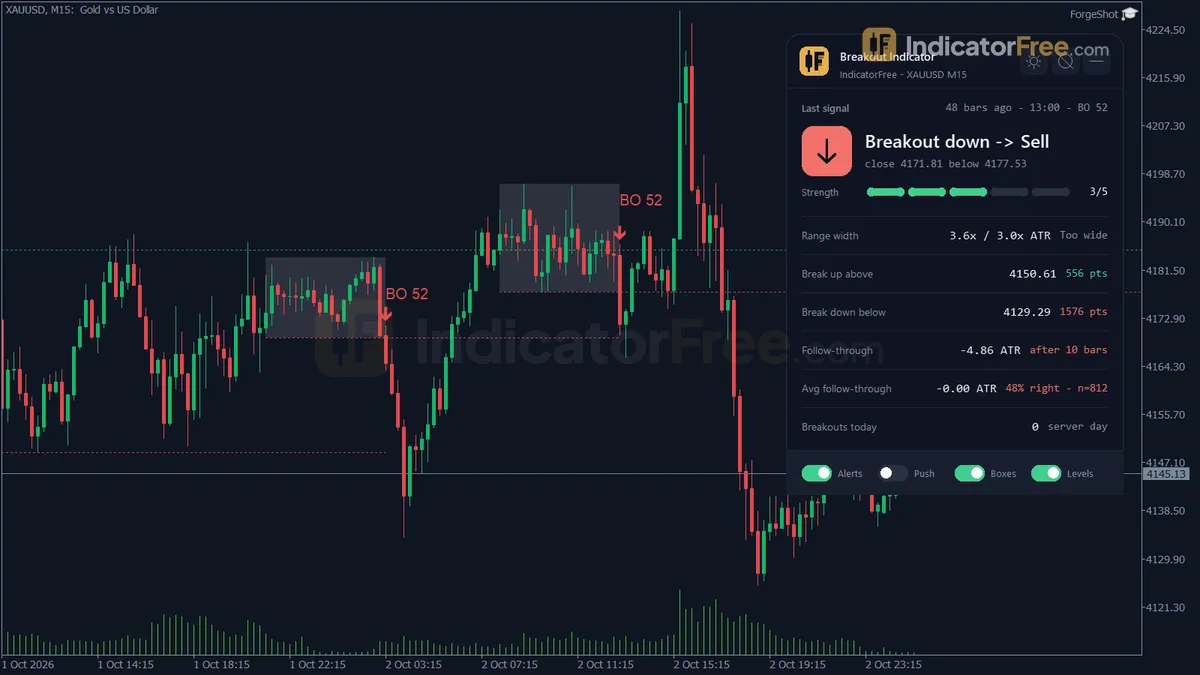
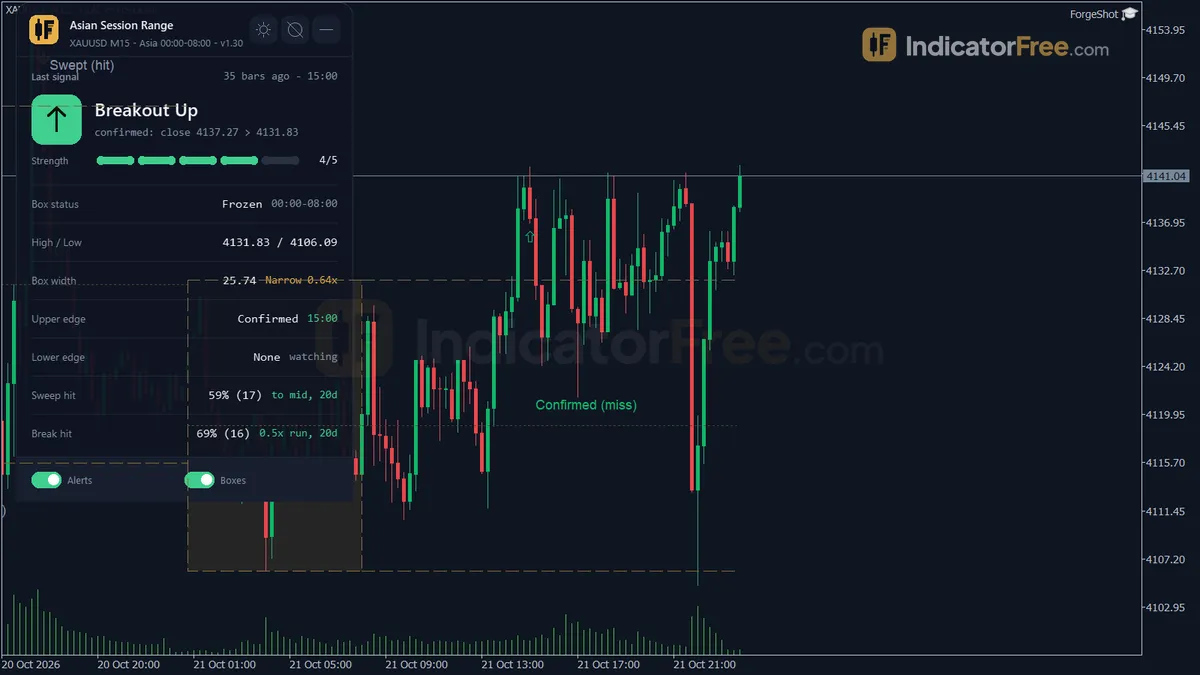
Breakout and session indicators mark the price boxes the market builds before it moves. They draw the Asian range, the London and New York opens, opening ranges, kill zones, breakout levels, retest zones and failed breaks. The problem they solve is simple: drawing these boxes by hand every day is slow and inconsistent, and a tool draws them the same way every time.
Why the Asian, London and New York sessions shape breakouts
The forex market trades around the clock, but activity is uneven. You can read more in how the forex market works.
The Asian session is usually quieter for most major pairs. Price often builds a tight range overnight. When London opens, volume rises and that range is often tested. New York adds a second wave, and the overlap of London and New York is typically the most active window of the day.
Session tools mark these periods using your broker's server time. That is the first thing to check after install: if your broker's clock differs from what the tool expects, the boxes will be drawn in the wrong place. Adjust the session hours in the inputs. The installation guide covers where inputs live.
Session range, opening range, kill zone or retest tool
| Tool type | What it marks | Fits traders who | Main limit |
|---|---|---|---|
| Session range (Asian, London, NY) | High and low of a set time window | Trade the day's first big move | Times depend on broker clock and daylight saving |
| Opening range | High and low of the first N minutes or bars | Trade intraday momentum | Range size varies a lot day to day |
| Kill zones | Time windows with higher activity | Want to trade only at set hours | Marks time, not price |
| Breakout and retest | Level that broke and the zone price may return to | Prefer waiting for confirmation | Strong moves often never retest |
| False breakout / trap | Breaks that closed back inside the range | Fade failed moves | Needs a fast decision, signals form after the fact |
If you can watch the open, a session range tool is the natural start. If you can't sit through the open, a breakout and retest zone tool lets you act later.
Three ways to trade a range break
Each entry method has a trade-off:
- Stop entry: place a pending order a few pips beyond the range. You never miss the move, but you catch every false break too.
- Close entry: wait for a candle to close outside the range. Fewer fakes, but a worse entry price.
- Retest entry: wait for price to come back to the broken edge and hold. The tightest stop, but many moves leave without you.
Example: The Asian range on GBPUSD runs from 1.2700 to 1.2740, a 40-pip box. Your rule is a close entry on M15. At 08:15 a candle closes at 1.2752. You buy at 1.2752 with a stop at the range middle, 1.2720, which is 32 pips. Your first target is one range height above the top, 1.2780, for a gain of 28 pips. If the next candle closes back at 1.2735, inside the box, the break has failed and the trade is likely to stop out.
Four signs a range break is a false breakout
The most common misreading in this group is treating any poke beyond the range as a breakout. Many breaks are just a quick spike that runs the stops sitting above or below the box, then returns.
A short checklist before you trust a break:
- The candle closed outside the range, not just wicked through it.
- The range is not unusually wide compared with recent days.
- The break agrees with the higher-timeframe trend.
- No major news release is due within the next 30 minutes.
If price breaks out and then closes back inside within one or two candles, treat it as a failed break. A false breakout trap tool highlights exactly this pattern. Some traders fade it, entering back toward the other side of the range. Note that these signals only exist after the close back inside, so they can never appear early.
Measure a break's energy with volatility and volume
Breakout tools tell you where. They work better when another group tells you whether the break has energy.
- If the range is narrow compared with its average daily range, then a break has more room to travel. The volatility and channel indicators help you measure this.
- If tick volume on the breakout bar is well above average, then more participants joined the move.
- If the break goes against a clear trend filter on a higher timeframe, then expect more failures and keep size small.
Breakouts also have honest limits. Ranges get drawn after they form, slippage at the open can be large, and quiet holiday sessions produce many fake breaks.
Record 20 days of Asian ranges and London breaks
Pick one pair and one session. On a demo account, mark the Asian range for 20 trading days and record which way London broke it, whether it retested, and whether the break failed. If you want these rules automated, study the London open breakout EA in the tester.