









Golden cross
Also called 50/200 golden cross, 50/200 SMA crossover
A golden cross is when the 50-period simple moving average crosses above the 200-period one and a candle closes with it still above. The classic version is read on the daily chart. Traders take it as a sign that a downtrend may be turning into an uptrend.
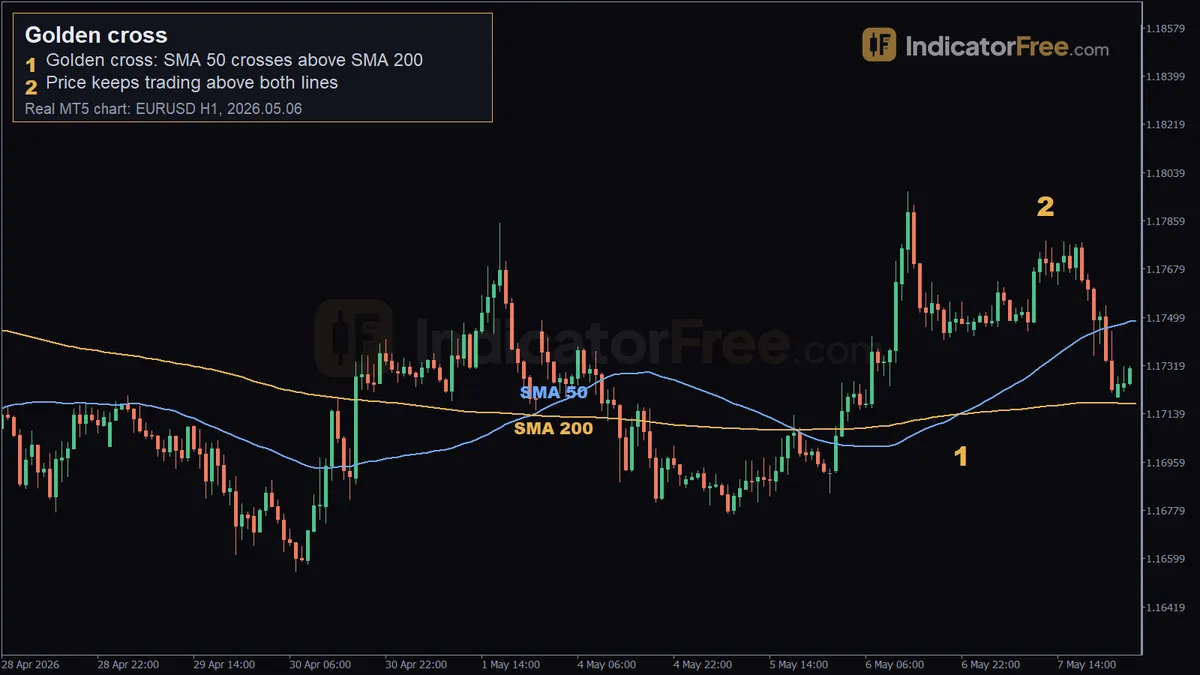
A golden cross is easy to see, so many traders act on it. Traders lose money on it in two ways. Some buy a cross that flips straight back. Others buy so late that the stop has to sit far below the entry.
The classic golden cross is a daily-chart signal
When stock, index or crypto traders say "golden cross", they almost always mean the 50-day and 200-day simple moving averages on a daily chart. That cross compares about 10 weeks of trading with about 40 weeks, so it describes a trend that lasts months.
The same rule works on any timeframe, and many forex traders use it on 1-hour or 4-hour charts. On a 1-hour chart, the 50-period average covers about two days and the 200-period average about eight. So the cross there describes a move of days, not months. The example and Lab numbers below come from 1-hour and 4-hour charts. Treat them as the short-term version, not the classic daily signal.
How to spot a golden cross, step by step
- Put a 50-period and a 200-period simple moving average on your chart. Faster pairs such as 20/50 or 9/21 are ordinary crossovers, not golden crosses.
- Check the setup: price has been falling and the 50-period average sits below the 200-period average.
- Watch the 50-period line turn up and close the gap.
- Wait for a candle to close with the 50-period average above the 200-period average. A cross that shows while the candle is still open can undo itself before the close.
- Confirm that price trades above both averages after that close.
- Look at the slope of the 200-period line. Flat or rising makes a cleaner signal. If it still points down, the signal is weaker.
The drawing below shows the order of events. Price turns first, the 50-period average follows, and the 200-period average reacts last.
A golden cross that holds vs one that snaps back
A valid golden cross holds. After the close, price stays above both lines for several candles and the gap between the averages keeps widening. A broken cross snaps back. Price stalls and drops back through both lines, and the averages cross the other way within a few candles, which cancels the signal.
All Lab numbers on this page come from EURUSD and XAUUSD broker demo data on the 1-hour and 4-hour charts, 2025-10-02 to 2026-10-02, counted by the IndicatorFree Lab. They are past data, not a forecast. The bars below put the slow pair next to faster pairs on EURUSD 1-hour, so you can see what the slower averages change: how often each pair crossed, and what share of those crosses the next cross reversed within 5 candles.
The slow pair gave far fewer signals. None of its 42 crosses on EURUSD 1-hour was reversed within 5 candles. That is a small sample, and the result does not carry over to every market: on XAUUSD 1-hour, 10% of 39 crosses were reversed. A cross can also hold for 5 candles and still fail later, so you still need a stop.
A real EURUSD 1-hour golden cross, marker by marker
The chart at the top of the page shows the real SMA 50 and SMA 200 lines; the drawing below repeats the prices with the trade levels. It is a past example, not a prediction. The marked prices and dates come from the real chart. The candles between them are simplified.
The downtrend that came before this cross happened earlier and is off-screen. Price had already climbed a long way by the time the slow averages caught up, which is why it sat so far above them at the cross.
Marker 1 (2026.05.06 22:00): the SMA 50 at 1.17142 crossed above the SMA 200 at 1.17139, with price at 1.17476. The two averages were only 0.3 pips apart. When the lines are this close, only a closed candle tells you the cross is real.
Marker 2 (2026.05.07 12:00): 14 candles later, price was at 1.17783 and still above both lines. This follow-through is what separates a valid cross from a snap-back. Over the 25 candles after the cross, price moved 31 pips up.
Trading the golden cross: entry, stop and target
Buying the EURUSD 1-hour cross at the candle close
The prices come from the example above. The 0.10 lot position size is an illustrative example. At 0.10 lot (10,000 units), one pip on EURUSD is worth $1.
- Entry: buy at the close of the cross candle, near 1.17476.
- Stop loss: at the SMA 200, 1.17139. If price falls back under the slow average, the uptrend idea is gone.
- Target: 1:1, the same distance above the entry as the stop is below it.
Price at Marker 2, 1.17783, was 3 pips short of that target. The 31-pip move was smaller than the 33.7-pip risk. The cause: price was already far above the averages when they crossed, so the logical stop sat far away.
Neither the target nor the stop was hit in the candles shown, so the trade is still open. You now have to decide: keep it and let the stop or the target close it, or close it at a time limit you set before you entered.
A rule you can use: if your stop distance is larger than the distance from entry up to the last swing high on your chart, cut your position size or wait for a pullback toward the averages before you buy. In this example, 33.7 pips of risk met a 31-pip move.
When the golden cross works and when to skip it
The signal reads best when a market is starting to trend after a decline. On the 4-hour chart, SMA 50/200 crossed 0.8 times a month on both EURUSD and XAUUSD (9 crosses each), and none was reversed within 5 candles. Nine crosses is too few to rely on.
Skip it right after a long sideways market. In a range, price can cross both averages again and again before any trend starts. On EURUSD 1-hour, price closed across its SMA 200 4 times a week on average, so price crossing that line on its own tells you very little.
| Pros | Cons |
|---|---|
| Few signals to manage, and less screen time than fast crossovers | Lagging: it confirms a move already under way, which often puts the stop far from entry |
| On EURUSD 1-hour and 4-hour and XAUUSD 4-hour, none of the 50/200 crosses snapped back within 5 candles | Rare on slower charts: 0.8 crosses a month on EURUSD 4-hour |
| Easy to define: anyone using the same two averages sees the same cross | Says nothing about how far price will travel after the cross |
Golden cross and death cross: the bullish and bearish versions
The golden cross is the bullish version. The bearish death cross mirrors every step: the 50-period average crosses below the 200-period one after a rise, you sell at the close of the cross candle, and the stop sits above the 200-period line.
Practical tips for trading a golden cross
- If you trade the 1-hour chart, look at the daily chart first. A short-term cross that agrees with the daily trend has the bigger trend behind it.
- Measure the gap from price to the 200-period line before you click buy. That gap is your risk.
- Check how your own instrument behaved before you trust the signal. On the 1-hour chart, 10% of gold's 50/200 crosses reversed within 5 candles, against none on EURUSD.
- Set an alert at the cross and decide when the candle closes, not while it is still forming.
Quick checklist
- 50 closed above 200 on a finished candle, with price above both
- 200-period line flat or rising, not inside a range, and in line with the daily trend
- Stop distance smaller than the room up to the last swing high
FAQ
Should I use simple or exponential moving averages for a golden cross?
The classic definition uses simple averages. Exponential averages react faster, so they cross earlier but also flip back more often. On EURUSD 1-hour, 16% of EMA 20/50 crosses were reversed within 5 candles, against 4% for SMA 20/50.
Can I use a golden cross trade's opposite signal as my exit?
You can close a long when the death cross appears, but that signal lags as much as the entry did. Often a large part of the move is gone by then. A stop under the 200-period line or a fixed target usually gets you out sooner.