Moving average crossover
Also called MA crossover, MA cross, moving average cross, EMA crossover, SMA crossover
A moving average crossover is the point where a faster moving average crosses a slower one on a price chart: a cross upward suggests an uptrend may be starting, and a cross downward suggests a downtrend may be starting.
Spotting a cross takes two seconds. The hard part is deciding which crosses deserve your money. In a flat market the two lines can swap places again and again, and if you trade every swap without a filter, each one can turn into a losing entry.
How to confirm a moving average crossover
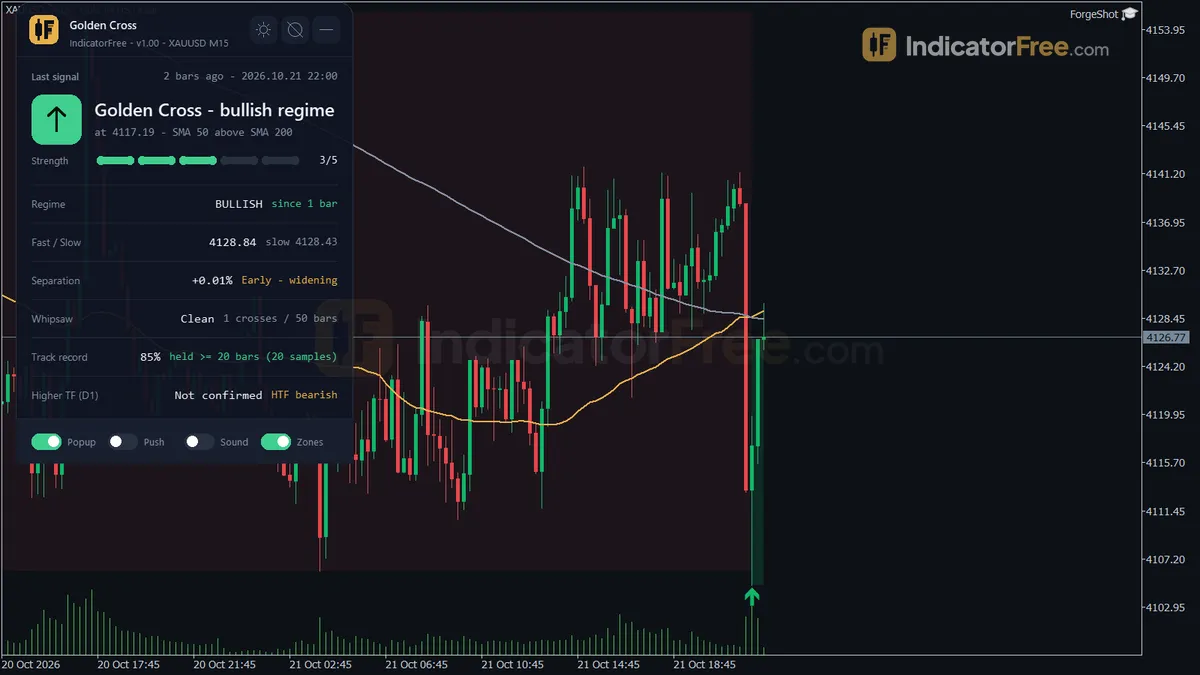
You need two averages of the same type on one chart. The fast average has a short period and follows price closely. The slow average has a long period and shows the wider direction. A common short-term pair is the 9 and 21 exponential moving average (EMA). A slower pair is the 50 and 200 simple moving average (SMA). When the pair is the 50 and 200 averages, a bullish cross is called a golden cross and a bearish one a death cross.
Run this checklist on every cross:
- The fast line has crossed the slow line, and the candle has closed with the fast line on the new side. A cross inside a candle that is still open can undo itself before the close.
- Price has closed beyond both lines in the direction of the cross.
- The slow line has started turning in the direction of the cross. It is not flat and not still pointing the other way.
- After the cross, the two lines move apart instead of sticking together.
- There was no cross in the opposite direction in the last few candles. Crosses that come back to back mark a range, not a trend.
- Your stop is set below (for a buy) or above (for a sell) the last swing, and your size is worked out from it.
A common mistake is to treat price closing across one average as a crossover. It is not. On EURUSD 1-hour, price closed across its SMA 20 13.6 times per week on average. Over the same period, the SMA 20/50 pair crossed 10.8 times per month (IndicatorFree Lab, 2025-10-02 to 2026-10-02, past data, not a forecast). Using two lines filters out much more noise.
Strong crosses vs weak or broken crosses
A strong cross comes after price has already started to move. The slow line is bending, candles close on one side, and the fast line pulls away. A weak cross happens when both lines are flat and tangled. The fast line drifts across the slow one only because price is wobbling sideways.
A cross is broken when the opposite cross arrives within a handful of candles, or when price closes back on the wrong side of the slow line. Either way, the trade idea is cancelled. It is not a reason to trade the other direction.
The drawing below compares the two cases.
How often crosses flip back: Lab counts by average pair
Faster pairs give you more signals and more false starts. The IndicatorFree Lab counted crosses on 12 months of past broker demo data for EURUSD (2025-10-02 to 2026-10-02, 6,222 one-hour candles). For each pair, the chart below shows the share of crosses that were reversed by the next cross within 5 candles. These are past data, not a forecast.
The number of crosses per month on the same chart was 22.6 for the EMA 9/21, 8.9 for the EMA 20/50, 10.8 for the SMA 20/50 and 3.5 for the SMA 50/200. Gold looked much the same: on XAUUSD 1-hour over the same period, the EMA 9/21 crossed 21.9 times per month, and 24% of those crosses were reversed within 5 candles.
A simple rule follows from this. If you trade a fast pair like 9/21, add a filter: a slow trend line, a higher timeframe, or a pullback entry. In this sample, about one fast cross in five reversed within 5 candles. If you would rather not use filters, pick a slower pair and accept far fewer signals.
Reading the EURUSD 1-hour EMA 9/21 cross, marker by marker
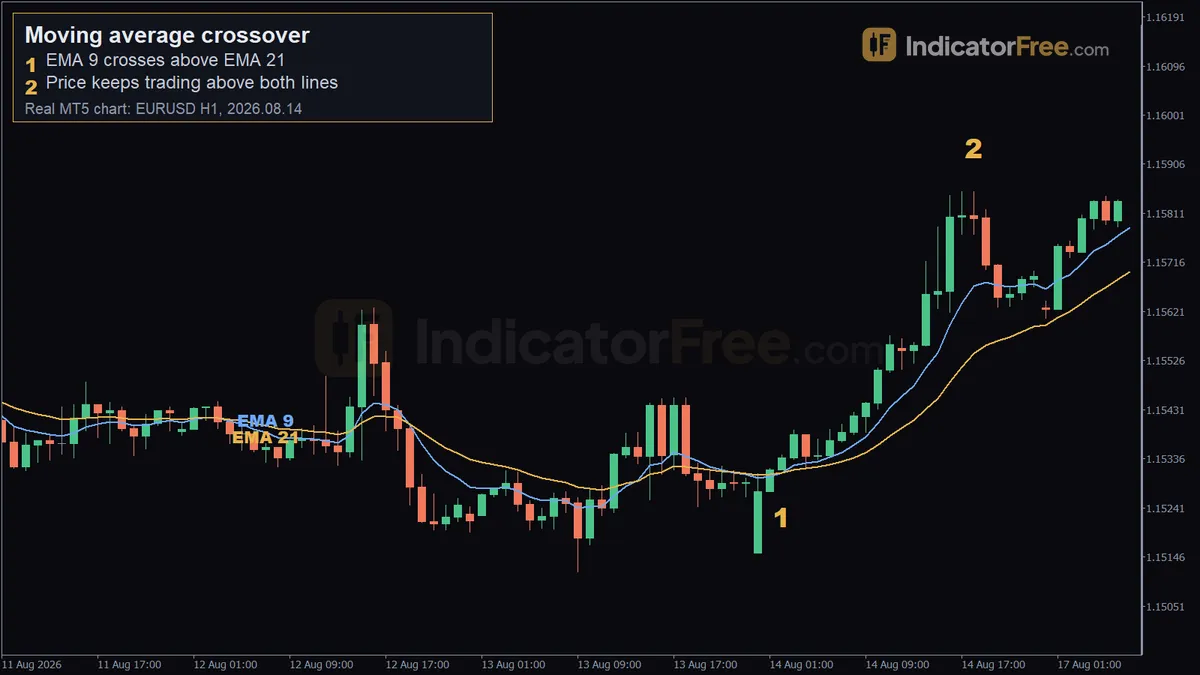
The chart at the top of the page is a past example from EURUSD on the 1-hour timeframe. It is not a prediction.
- Marker 1 (2026.08.14 02:00, 1.15315): the EMA 9 crossed above the EMA 21. At the cross both averages read 1.15309, so the lines met exactly. A trader following the checklist would wait for this candle to close before acting.
- Marker 2 (2026.08.14 18:00, 1.15853): price was still trading above both lines. This is how a valid cross looks afterwards: no quick cross back down, and candles holding above the slow average.
Notice that the cross came after price had already turned. Every average lags price, so a crossover catches the middle of a move, never the exact low.
Moving average crossover trading setups
Both setups below use one illustrative example: a USD-quoted pair, a $10,000 account, 1% risk per trade and a 25-pip stop.
Setup 1: Trade the cross only with the bigger trend
Only take crosses that agree with the slower trend. For example, take a bullish 20/50 cross only while price is above a rising 200 average.
- Entry: buy at the close of the cross candle.
- Stop loss: below the most recent swing low (we assume 25 pips away).
- Target: twice the risk, 50 pips. Or move your stop up under the slow average as price rises (a trailing stop) and exit on the opposite cross.
The calculation below turns that stop into a position size.
Setup 2: Wait for the pullback to the slow average
Do not enter on the cross candle. Instead, wait for price to pull back toward the slow average and then close back up from it. You get in later, but your stop sits closer, and if price falls through the slow average instead of bouncing, you never enter.
- Entry: buy when a candle closes back up from the slow average.
- Stop loss: below the pullback low, 25 pips away in this example.
- Target: 50 pips, which keeps a 2-to-1 reward to risk. The stop is the same 25 pips, so the size is the same 0.40 lots.
When crossovers work and when to stand aside
Crossovers work best when a market leaves a range and starts a sustained move. That is when the lines separate and stay apart. Stand aside when the slow average is flat, when price is stuck in a tight range, and in the minutes before major news, when price can whip across both lines.
| Pros | Cons |
|---|---|
| Rules are objective: the lines either crossed on a closed candle or they did not | Lags price, so you miss the start of every move |
| Works the same way on any market and timeframe | Gives back-to-back false signals in sideways markets |
| The opposite cross gives you a ready-made exit | Fast pairs reversed often in Lab data (21% for EMA 9/21 on EURUSD 1-hour) |
| Easy to set an alert for | Slow pairs give few signals (0.8 per month for SMA 50/200 on EURUSD 4-hour) |
Practical tips for trading crossovers
- Use the same type for both lines. Mixing an EMA with an SMA changes how far each line lags and makes the cross harder to read.
- Act only on closed candles. A cross that appears halfway through a candle is only a preview.
- Check the higher timeframe. On EURUSD 4-hour, the EMA 9/21 crossed 5.6 times per month, compared with 22.6 on 1-hour (Lab, same period, past data, not a forecast). A higher-timeframe cross in the same direction gives your trade more backing.
- Do not reverse on every opposite cross. Close the trade, then let the checklist decide whether the new cross is worth taking.
- Test each market on its own. On XAUUSD 4-hour, 28% of EMA 9/21 crosses reversed within 5 candles, compared with 19% on EURUSD 4-hour (Lab, past data, not a forecast).
FAQ
Can I get an alert when two moving averages cross?
Yes. Set the alert on the fast average crossing the slow average, not on price crossing a single average. Price crosses one average far more often, so that alert fires on noise. Set it to trigger once the candle closes, not the moment the lines touch. Otherwise you will get alerts for crosses that undo themselves before the close.
Should I exit my trade when the averages cross back?
The opposite cross is a simple exit rule, but it gives back part of the move because it lags. Many traders take part of the position off at a fixed target and use the opposite cross only to close the rest.