Overbought Confluence
Free MT5 oscillator that scores RSI, Stochastic, CCI and Williams %R overbought confluence. Lab test: no signals on EURUSD M15, Jul-Oct 2026.
- Repainted
- Not tested
- Signals / week
- —
- Tested on
- —
- Tested
- 2026-10-05
Overview
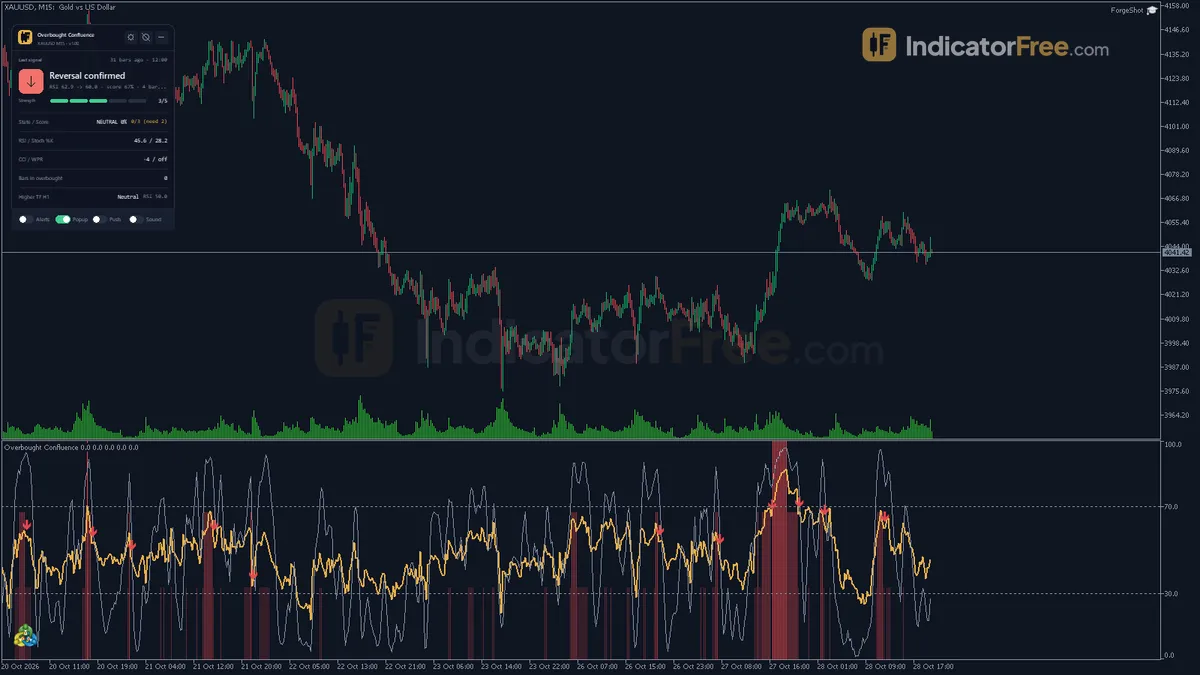
Overbought Confluence is a free MT5 indicator that runs in its own subwindow. It plots an Overbought Score histogram showing what percent of its enabled oscillators are overbought on the closed bar. It also draws RSI and Stochastic %K lines and a reversal arrow. It suits traders who want to see whether RSI, Stochastic and CCI agree before shorting or exiting a stretched rally. Expect few arrows: none fired in the Lab's 3-month EURUSD M15 test (2026.07.06 to 2026.10.02).
What it draws
It counts how many oscillators agree the market is overbought, instead of trusting one alone.
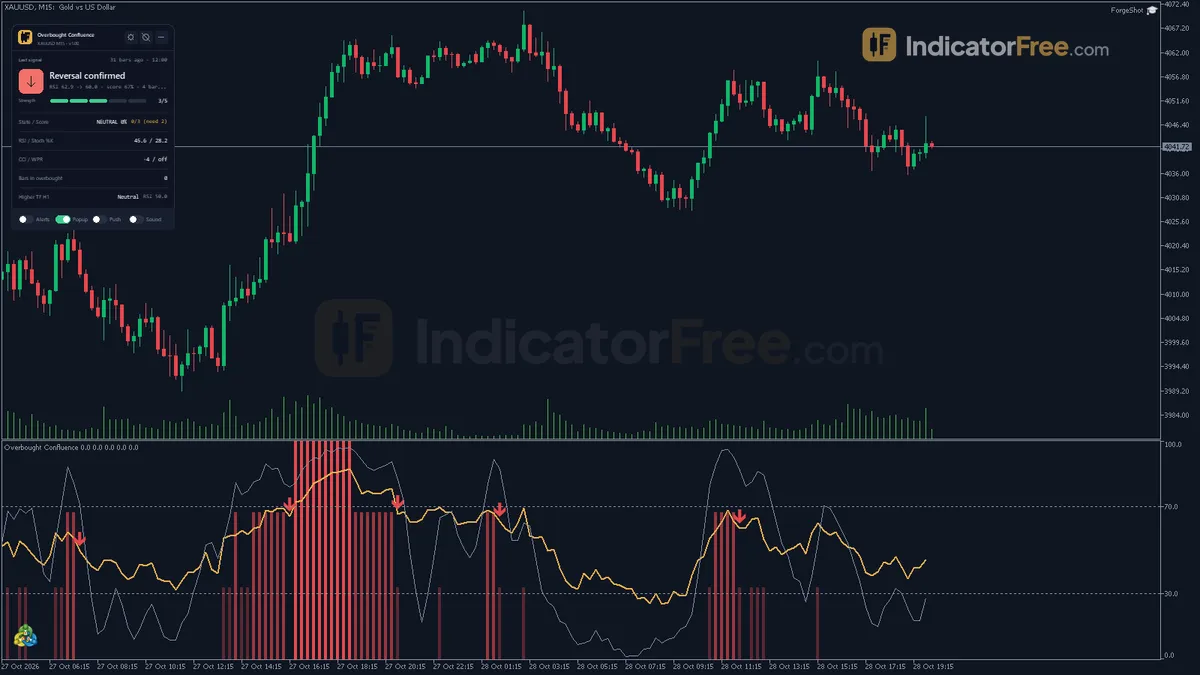
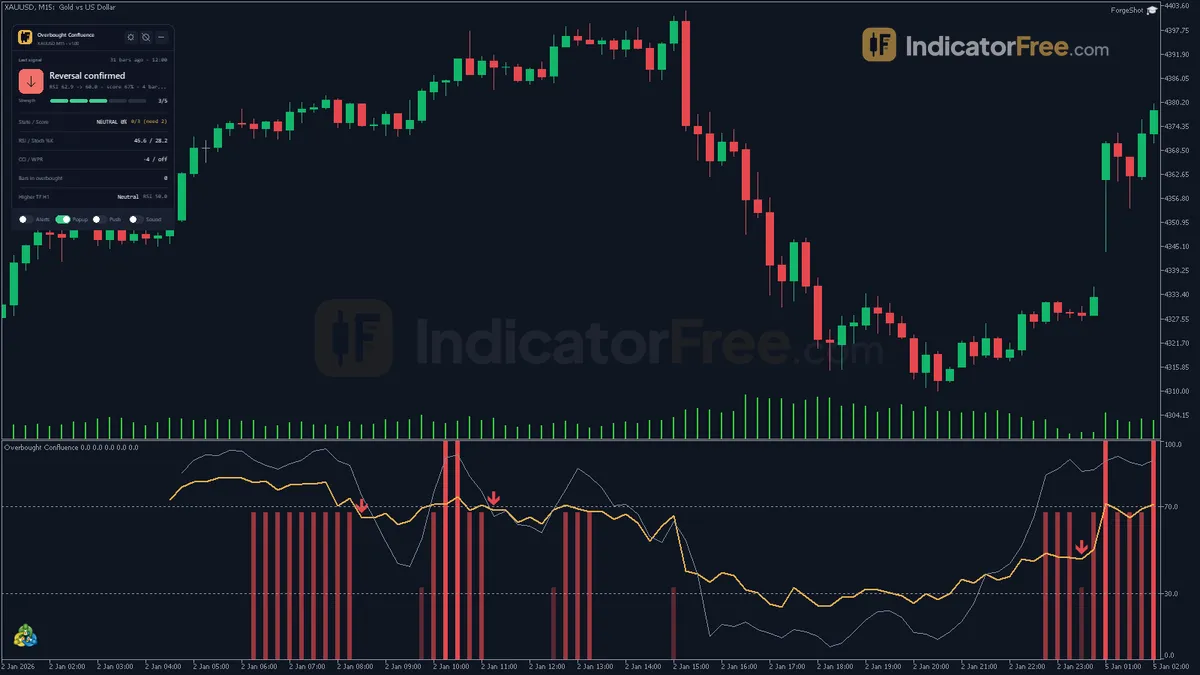
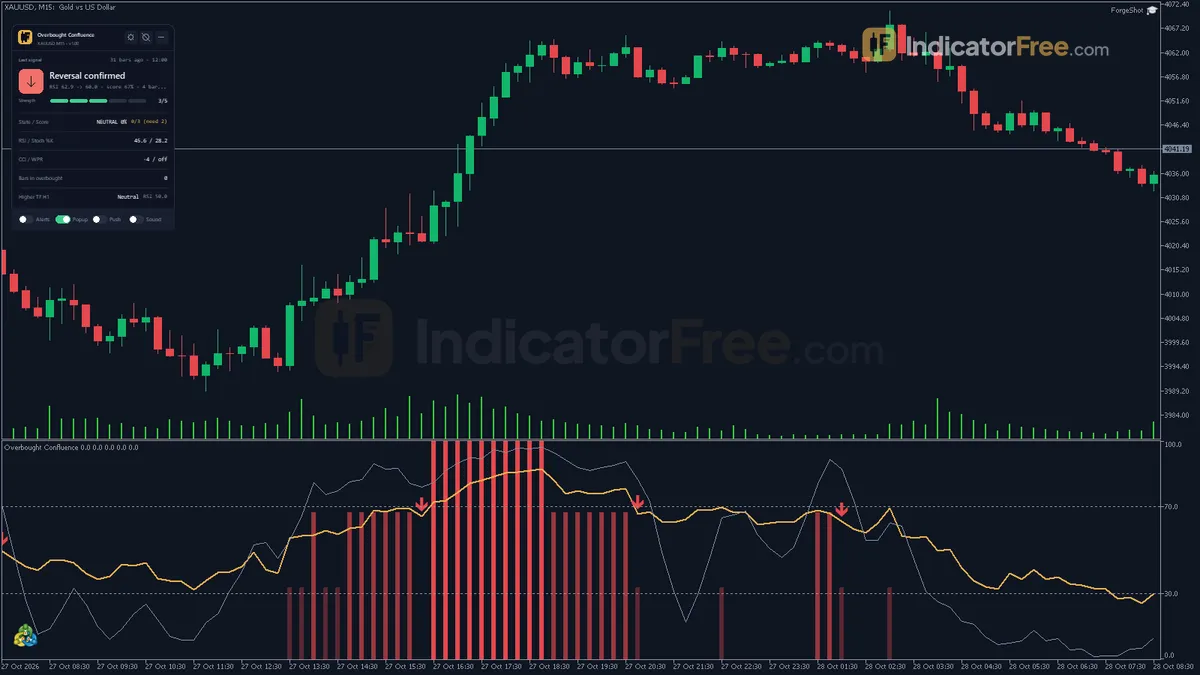
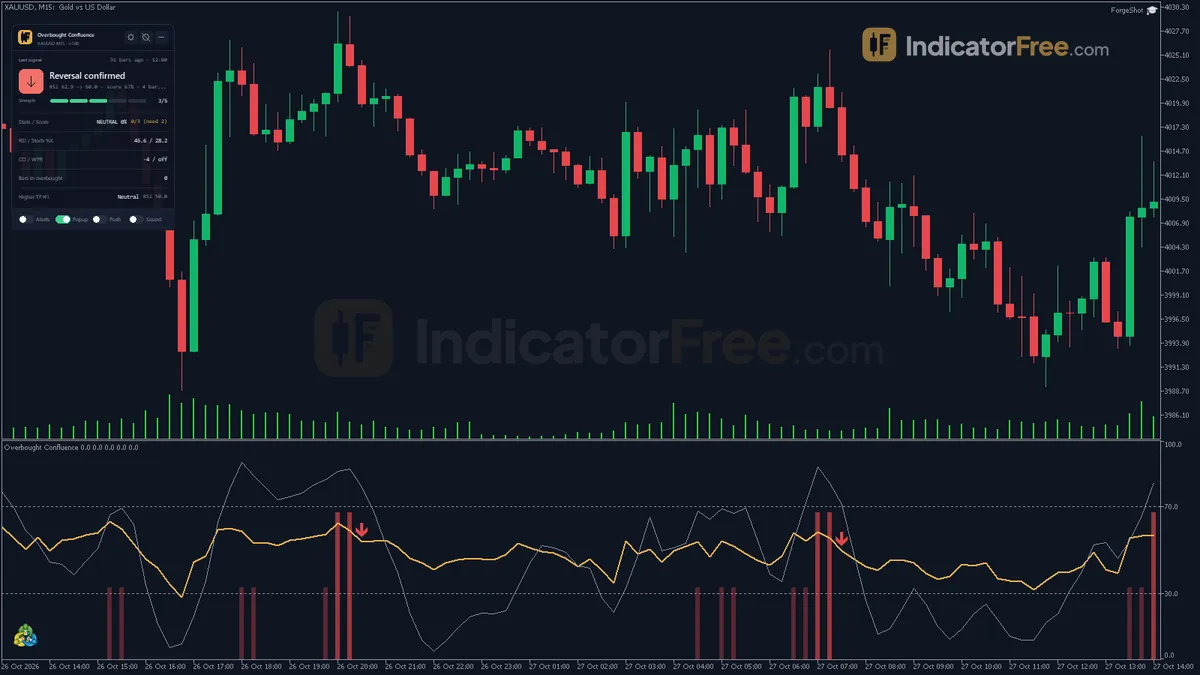
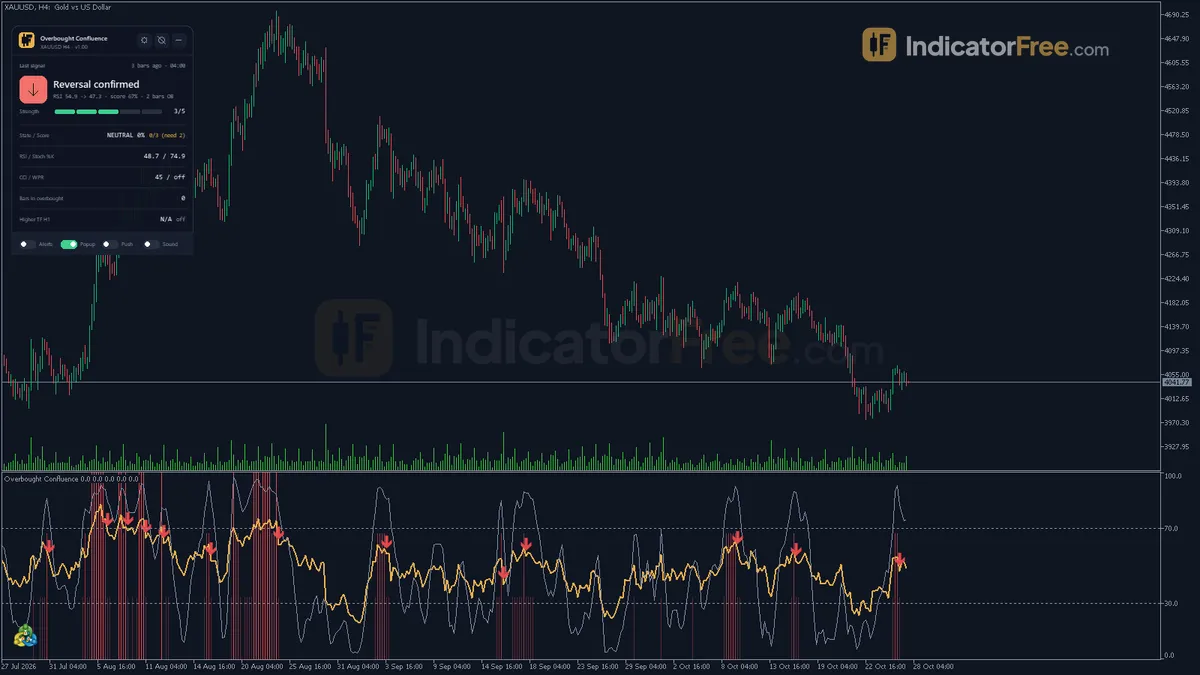
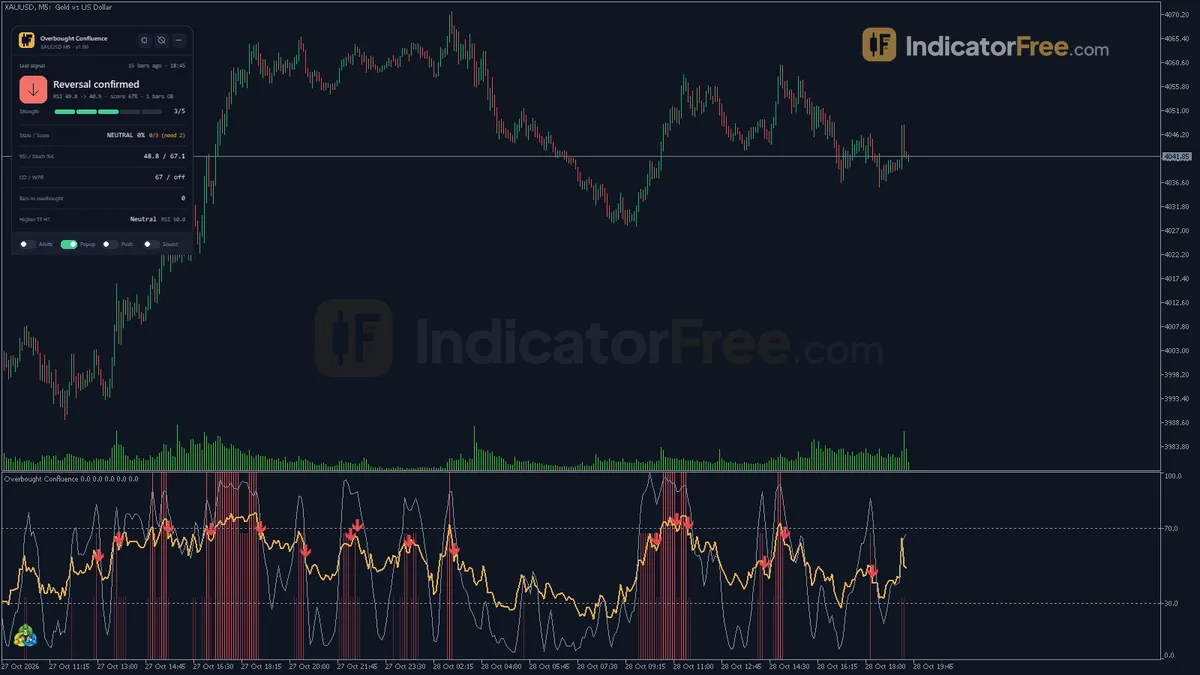
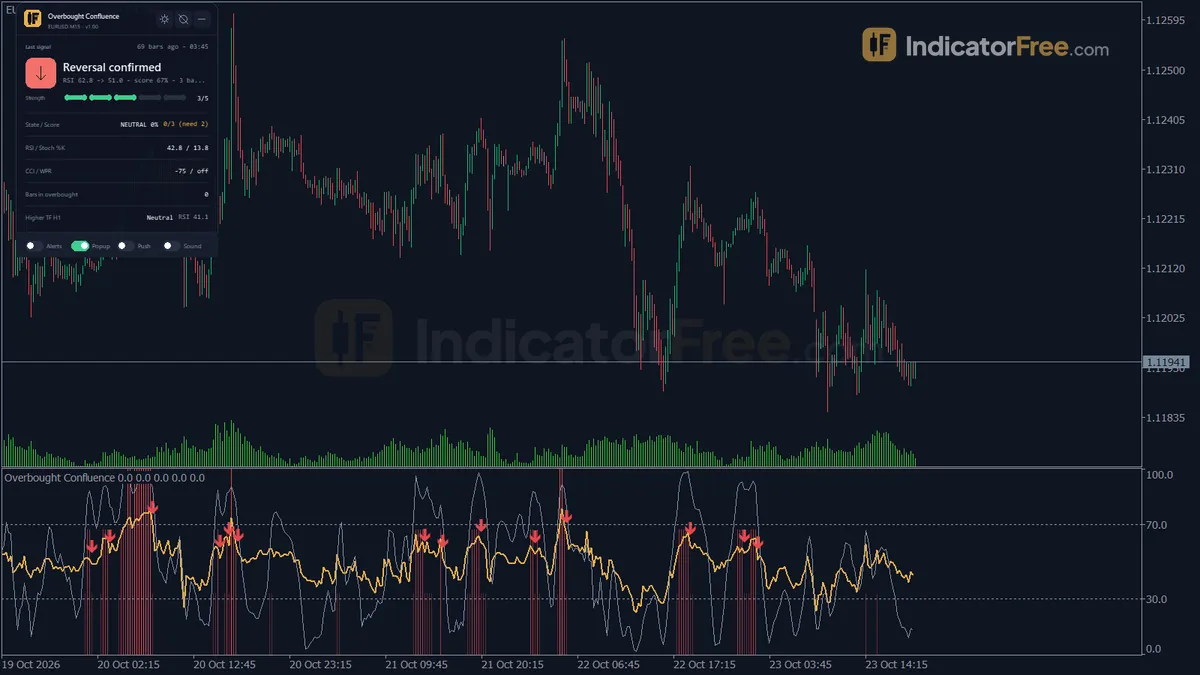
- Overbought Score (histogram): 0-100, the share of enabled oscillators at or above their own threshold on the closed bar.
- RSI and Stochastic %K (lines): two of the counted oscillators, drawn so you can see them. CCI and Williams %R appear only as values on the panel.
- Reversal Confirmed arrow: the overbought state has ended and momentum is turning down. This arrow is on by default.
- Overbought Entry arrow: the bar has just become overbought. It only appears when you switch the reversal confirmation off.
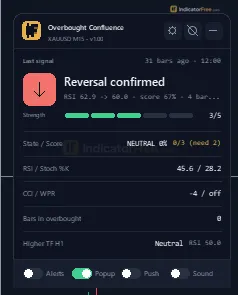
- Overbought Status panel: an on-chart summary of the last signal, the current state and the oscillator values.
RSI is always part of the count. Stochastic %K and CCI are on by default, and Williams %R is off. With the defaults, the score therefore moves in steps of one third.
What the Lab measured and what it means for you
The Lab tested version 1.00 (146.6 KB) on MT5 build 6230 on 2026-10-05. For the repaint check, it ran the indicator on EURUSD M15 from 2026.07.06 to 2026.10.02. No signals appeared in that window. That window covers about 3 months of M15 bars, roughly 6,000 bars. The Lab's record does not state which settings the test used. If they were the defaults (RequireReversalConfirm and RequireBearishClose both true), every reversal condition had to pass on one closed bar, and the result reads as a very strict default rule.
In practice, this has two consequences:
- The Lab could not test whether the arrows repaint, because there were no arrows to check.
- No hit rate exists for this tool. Nobody has measured how often price moved in the arrow's favour.
The page's claims are limited to how the signals are built, not how well they work. Before you trade any arrow, scroll back through history on your own symbol and timeframe to see how often it fires at all.
Who it is built for
It suits discretionary traders who already look for short or exit setups after strong up-moves and want one place that shows whether RSI, Stochastic and CCI agree. It does not suit traders who want an automatic entry signal with a proven record.
Specifications
- Platform
- MetaTrader 5
- Version
- 1.00
- Type
- Indicator
- Window
- Separate window
- Draws
- 1 histo, 2 lines, 2 arrows, 1 panel
- Alerts
- popup, push, sound
- Repaints
- not tested
- Inputs
- 26
- Tested on
- MT5 build 6230 · 2026-10-05
Repaint test
Repaint: not tested. This indicator draws histo, line, arrow, panel, which the IndicatorFree harness cannot read through iCustom().
IndicatorFree — tested 2026-10-05 · MT5 build 6230. Results come from historical data, not live trading, and do not guarantee future results.
What it draws
- A histogram (Overbought Score) in a separate window.
- A line (RSI) from buffer 2.
- A line (Stochastic %K) from buffer 3.
- Arrows (Reversal Confirmed) from buffer 4, drawn on the closed bar.
- Arrows (Overbought Entry) from buffer 5, drawn on the closed bar.
- An on-chart panel (Overbought Status); values shown in the panel are not exposed as buffers.
Inputs
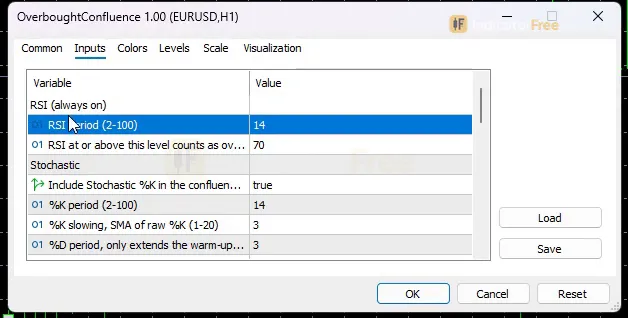
| Input | Default | What it does |
|---|---|---|
| RSI_Period | 14 | RSI period (2-100) |
| RSI_Threshold | 70 | RSI at or above this level counts as overbought (51-95) |
| UseStochastic | true | Include Stochastic %K in the confluence count |
| Stoch_K | 14 | %K period (2-100) |
| Stoch_Slow | 3 | %K slowing, SMA of raw %K (1-20) |
| Stoch_D | 3 | %D period, only extends the warm-up (1-20) |
| Stoch_Threshold | 80 | %K at or above this level counts as overbought (51-95) |
| UseCCI | true | Include CCI in the confluence count |
| CCI_Period | 14 | CCI period (2-100) |
| CCI_Threshold | 100 | CCI at or above this level counts as overbought (50-300) |
| UseWPR | false | Include Williams %R in the confluence count |
| WPR_Period | 14 | Williams %R period (2-100) |
| WPR_Threshold | -20 | Williams %R at or above this level counts as overbought (-50 to -5) |
| MinConfirmations | 2 | Oscillators that must be overbought together (1-4, capped at the number enabled) |
| RequireReversalConfirm | true | true = arrow when the bar exits overbought with RSI falling; false = arrow when the bar enters overbought |
| RequireBearishClose | true | Reversal arrow also needs the bar to close below its open |
| HTF_Timeframe | H1 | Higher timeframe for the RSI context on the panel (PERIOD_CURRENT or not above the chart = off) |
| EnableAlerts | false | Alert on a new arrow (master switch) |
| AlertPopup | true | Show a popup Alert() window |
| AlertPush | false | Send a push notification to MetaTrader mobile |
| AlertSound | false | Play a sound |
| AlertSoundFile | alert2.wav | Sound file from the MT5 Sounds folder |
| ShowPanel | true | Show the on-chart panel |
| Theme | Dark | Chart color theme |
| RestoreTheme | true | Restore the original chart colors when the indicator is removed |
| PanelScale | 1 | Panel size multiplier (0.6-2.0), DPI is applied automatically |
How to read it
Installing it
Copy the indicator file into your MT5 MQL5/Indicators folder, then refresh the Navigator and drag Overbought Confluence onto a chart. It opens in its own subwindow and recolors the chart, with Theme set to Dark by default.
Reading the Overbought Score histogram
Each oscillator is checked on the closed bar against its own threshold. By default those are RSI 70, %K 80 and CCI 100, plus Williams %R -20 if you enable it. The histogram shows the percent of enabled oscillators that pass.
With the default three oscillators, the readings work like this:
- 33.3: only one oscillator is overbought.
- 66.7: two oscillators agree, which meets the default
MinConfirmationsof 2. The bar now counts as overbought for the arrows. - 100: all three oscillators are overbought.
The figure below sketches a typical cycle. The score climbs into overbought, holds there, then drops back on a bearish bar, which is where the reversal arrow belongs.
The figure above is an illustration. For the real histogram and panel, see the screenshots on this page captioned "Close-up of the tool's own signal or zone" and "The on-chart panel, close up". The captions do not record the symbol or timeframe of these close-ups, so do not read them as part of the Lab's EURUSD M15 test, where no signals appeared.
The two arrows: only one mode is active
The RequireReversalConfirm input picks which arrow the indicator draws.
Reversal Confirmed (RequireReversalConfirm = true, the default) needs all of the following:
- The previous closed bar was overbought, meaning at least
MinConfirmationsoscillators were at or above their thresholds. - The current closed bar is no longer overbought.
- RSI is lower than on the previous bar.
- With
RequireBearishCloseon, the bar also closes below its open.
The steps below show the order in which these checks have to pass:
- 1Previous bar overboughtAt least MinConfirmations oscillators at or above their thresholds
- 2Current bar drops outFewer than MinConfirmations oscillators still overbought on the closed bar
- 3RSI fallingRSI lower than on the previous bar
- 4Bearish closeClose below open, only checked when RequireBearishClose is on
- 5Arrow drawnReversal Confirmed on the closed bar, alert if EnableAlerts is on
Overbought Entry (RequireReversalConfirm = false) fires on the closed bar that becomes overbought when the previous closed bar was not. It marks the start of a stretched move, not a turn.
The Overbought Status panel
The panel shows:
- the last signal and its strength;
- the current state and score;
- the RSI, Stochastic %K, CCI and Williams %R values;
- how many bars the market has been overbought;
- the RSI state on the higher timeframe set in
HTF_Timeframe(default H1).
The higher-timeframe line turns off if you set HTF_Timeframe to PERIOD_CURRENT or to a timeframe that is not above your chart. Use PanelScale (0.6-2.0) if the panel is too small or too large.
Inputs to change first
MinConfirmations(1-4, default 2): This is the main dial. Higher values demand more agreement, so you get fewer and stricter overbought states. 1 makes any single oscillator enough. The value is capped at the number of oscillators you have enabled.RequireBearishClose(default true): This is the strictest part of the reversal rule. Turning it off lets an arrow print on a bar that left overbought but still closed up.UseWPR(default false): This adds Williams %R as a fourth oscillator. The score then moves in quarters, so recheck whatMinConfirmationsmeans.- Thresholds:
RSI_Threshold(51-95),Stoch_Threshold(51-95),CCI_Threshold(50-300) andWPR_Threshold(-50 to -5). Lower thresholds make overbought states more common.
Stoch_D does not change the count. It only extends the warm-up period.
Alerts
Set EnableAlerts to true first, because it is off by default. Then choose where alerts go:
AlertPopup: a popup window in the terminal.AlertPush: a notification to MetaTrader mobile.AlertSound: plays the file named inAlertSoundFile(default alert2.wav) from the MT5 Sounds folder.
An alert fires on each new arrow.
Decision rule
Take a Reversal Confirmed arrow as a short or exit idea only if:
- the panel showed several bars in overbought before it, so the market was truly stretched rather than briefly touching the threshold; and
- the higher-timeframe RSI on the panel is not still pressing higher.
This filter is the Lab's suggestion and was not tested.
A common misread
The Overbought Entry arrow is not a sell signal. It marks the bar where momentum became stretched. Why a high score does not mean a top is covered under Limits you should know.
Installation
- 1Download OverboughtConfluence.ex5 from the button above (Google Drive).
- 2In MetaTrader 5: File → Open Data Folder → MQL5 → Indicators. Copy OverboughtConfluence.ex5 there.
- 3Restart MT5 or right-click Indicators in Navigator → Refresh.
- 4Drag Overbought Confluence onto a chart. For push alerts, enable "Allow push notifications" under Tools → Options → Notifications.
- Tested on MT5 build 6230.
Key terms and guides
- RSI
- RSI (Relative Strength Index) is a momentum line from 0 to 100 that compares the size of recent gains with recent losses. Traders use it to spot overbought and oversold moves and to see when momentum is fading.
- Momentum
- Momentum is how fast price is moving in one direction. The Momentum indicator compares the latest close with the close a set number of bars ago, so it shows whether a move is speeding up or slowing down.
- Overbought
- Overbought means a momentum oscillator, usually the RSI, has moved above a high threshold such as 70, showing a price move is stretched and may pause or turn down.
- Stochastic oscillator
- The Stochastic oscillator is a momentum indicator that compares the current close to the recent high-low range on a 0-100 scale, using %K and %D lines to flag overbought, oversold and momentum-turn signals.
- CCI
- The CCI (Commodity Channel Index) is a momentum oscillator that measures how far price has moved from its recent average. It is scaled so most readings sit between +100 and −100, and readings beyond those lines flag an unusually strong move.
- Williams %R
- Williams %R is a momentum oscillator that shows where the latest close sits inside the high-low range of the last N candles. Its scale runs from 0 (close at the high) to -100 (close at the low).
More on this subject: Oscillators & momentum guide, terms and tools
User reviews
No reviews yet. Members who download the tool can review it here.
Sign in and download the tool to review it.
Build a checklist with it
Overbought Confluence does one job on the chart: entry signal. Put it on the same chart as the tools below and the IndicatorFree panels merge into one checklist card, ordered trend, zone, signal, risk.
- Trend / contextParabolic SAR ProOverbought Confluence tells you when; this tells you which way the market leans, so you can skip signals against it.
- Zone / levelLiquidity SweepShows the zones and levels, so you can see whether a signal from Overbought Confluence fires at a level worth trading.
The Lab has not tested these combinations. Each tool is tested on its own; the card only lines up what each one says. Free members get 2 new tools a day. If one has to wait until tomorrow, install BlackBox to raise the limit to 5 a day (20 on a live account).
FAQ
Does Overbought Confluence repaint?
Repaint: not tested. This indicator draws histo, line, arrow, panel, which the IndicatorFree harness cannot read through iCustom().
Can I use Overbought Confluence in an EA?
Yes. Read buffer 4 (Reversal Confirmed) with iCustom() on bar 1 — the last closed bar.
Why can’t my EA read the zones?
Zones and the panel are chart objects, not indicator buffers, so iCustom() does not return them.
How do I get alerts on my phone?
Enter your MetaQuotes ID under Tools → Options → Notifications, tick "Enable push notifications", and keep the push alert input on.
Why does it open in a separate window?
It plots values on their own scale, so MT5 draws it below the price chart.
Does Overbought Confluence give buy signals?
No. Both arrows and the score only track the overbought side, so it has no oversold count and no buy arrow.
Why do I see no arrows on my chart?
All four reversal conditions must pass on one closed bar (see How it works). Scroll back further, or set `RequireBearishClose` to false and compare with the defaults.
What does the higher timeframe line on the panel need?
`HTF_Timeframe` must be above your chart timeframe. The default is H1, so it works on M5, M15 or M30 charts. On an H1 or higher chart, or with PERIOD_CURRENT, that panel line is off.
Will it change my chart colors?
Yes. The `Theme` input (default Dark) recolors the chart. With `RestoreTheme` left on true, your original colors come back when you remove the indicator.
Can I get alerts on my phone?
Yes. Set `EnableAlerts` and `AlertPush` to true, and MetaTrader mobile will receive a push notification each time a new arrow appears. Popup and sound alerts are switched separately with `AlertPopup` and `AlertSound`.
Changelog
- 1.00Initial release: four-oscillator confluence (RSI always on, optional Stochastic %K, CCI, Williams %R) with an adjustable `MinConfirmations` threshold. · 2026-10-09
Final verdict
The Lab's view
This is a well-built way to see whether RSI, Stochastic and CCI agree, and an optional Williams %R adds a fourth check. The score and arrows use closed bars only, the rules are fully adjustable, and the panel puts the higher-timeframe RSI next to the signal.
What the Lab cannot give you is a performance record. No signals appeared in the test window, so neither repaint behaviour nor a hit rate could be measured. Treat it as a momentum filter and exit tool that you check yourself, not as a tested entry system.
Limits you should know
- It only watches the overbought side. It has no oversold count and no buy arrows.
- RSI is always counted. You cannot build a score that leaves it out.
- Arrows can be rare. With the default reversal rule, every condition must line up on the same closed bar.
- Overbought is not a top. In trending markets, the score can stay high while price keeps going up.
Use it or skip it
The comparison below sums up when the tool fits your trading and when it does not.
- –You want to know if several oscillators agree before acting on a stretched rally
- –You manage long trades and want a momentum-exit cue
- –You will check the arrows on your own history before trusting them
- –You need buy signals or an oversold count
- –You want an entry signal with a Lab-measured hit rate
Settings to start with
Begin with the defaults: MinConfirmations 2, RequireReversalConfirm true and RequireBearishClose true.
If you see almost no arrows on your history, try these untested starting points:
- Set
RequireBearishCloseto false. - Or enable
UseWPRand keepMinConfirmationsat 2.
Neither change was tested by the Lab, so compare each one with the default on the same chart before using it. If arrows come too often on lower timeframes, raise MinConfirmations to 3. That is also an untested starting point to compare with the default.