









Williams %R
Also called Williams Percent Range, Williams' Percent Range, %R, WPR
Williams %R is a momentum oscillator that shows where the latest close sits inside the high-low range of the last N candles. Its scale runs from 0 (close at the high) to -100 (close at the low).
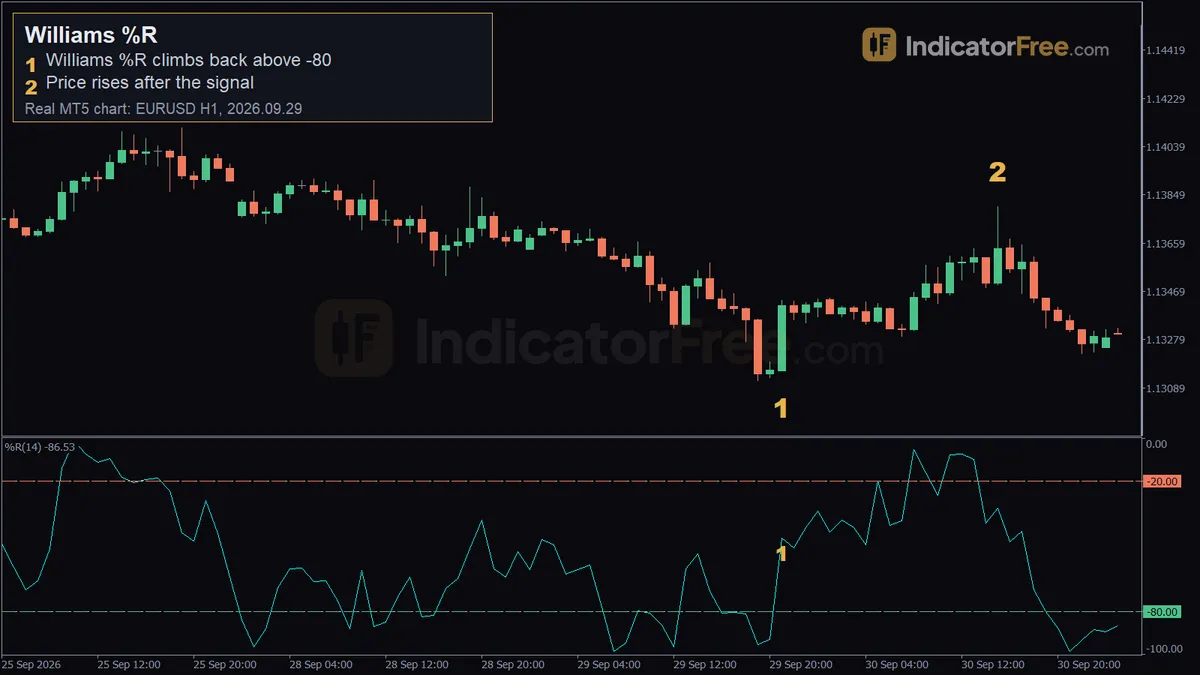
Most losses with Williams %R come from one habit: buying because the line touched -95, or selling because it touched -5. The moment worth trading is when the line leaves an extreme. That shows a push into the edge of the range has stalled, and it is where you plan your entry and your stop.
The Williams %R formula: where the close sits in the range
%R = (Highest High(N) - Close) / (Highest High(N) - Lowest Low(N)) x -100
The formula measures how far the close is below the top of the last N candles, as a share of the whole range. A reading of 0 means the close is at the period's high. A reading of -100 means it is at the period's low. The line says nothing about how big the move was. It only shows where the close finished inside the range.
The calculation below uses round, illustrative prices so you can redo it by hand.
If %R looks like a Stochastic turned upside down, that is because it is one. It uses the same inputs as the fast Stochastic %K, and %R = %K - 100. A Stochastic reading of 20 is the same as a %R reading of -80.
Reading -20 and -80: act on the exit, not the touch
Most traders draw two lines. A reading above -20 is overbought: closes are landing near the top of the recent range. A reading below -80 is oversold: closes are landing near the bottom.
A common misread is to treat -100 as a buy signal. It only means the latest close was the lowest of the period, and in a falling market that can happen candle after candle. The chart below uses illustrative EURUSD 1-hour prices. %R stays under -80 while price falls, then crosses back above -80 as price turns. Later it rises above -20 and finally drops back under it.
Acting on the exit, not the touch, keeps you from buying into a downtrend. If %R stays under -80 while price keeps making lower lows, the market is trending down, so don't buy. Wait for a close back above -80, and buy only if the low printed before that close has held.
Turning the -80 cross into a trade plan
Decide three things before you place the order: what triggers the entry, where the stop goes and what ends the trade. The two setups below apply the same plan to different charts.
Illustrative plan on the chart above
The oscillator chart above is an illustrative example, so you can redo each step.
- Entry trigger: the candle marked "Back above -80" closes with %R at -76. You buy at its close.
- Stop loss: the lowest low printed while %R was oversold sits on the candle just before the signal. Put the stop 2 pips below that low. Your risk from entry to stop is 17 pips.
- Exit: hold until %R drops back below -20. That happens on the last candle, marked "Back below -20". From the entry close to that close, price gained 37 pips.
At 0.10 lots on EURUSD (10,000 units, worth $1 per pip), you risk $17 to make $37, about 2.2 times the risk.
EURUSD 1-hour, 29 September 2026: the chart at the top of this page
The EURUSD 1-hour chart at the top of this page is a past example, not a prediction. On the 21:00 candle of 29 September 2026, Williams %R (14) climbed back above -80 with EURUSD at 1.13157. That is the first marker. Over the next 20 candles, price rose 39 pips.
- Entry trigger: buy only after a candle closes with %R back above -80. Here that close was 1.13157.
- Stop loss: just below the lowest low printed while %R was under -80, to the left of the first marker. If price trades back there, the bounce has failed.
- Exit: close when %R drops back below -20. By the second marker (30 September, 15:00) price was still above the entry, so the trade was still open.
When Williams %R works, and when to leave it alone
Works well:
- Ranging markets, where price moves back and forth between a ceiling and a floor
- Pullbacks on 1-hour charts and higher, where each crossing is built from enough price action to mean something
Avoid or use with caution:
- Strong trends, where %R can stay near 0 or -100 for many candles while price keeps going
- 1-minute and other very fast charts, where noise produces crossings that lead nowhere
- The minutes around major news, when one spike can push %R to an extreme and straight back
| Pros | Cons |
|---|---|
| Fixed 0 to -100 scale, quick to read, reacts fast to short swings | Crossings are frequent, so you need a level or a trend filter to sort them |
| Works on any market and timeframe and helps time entries inside a range | Ignores how big the move was. A 10-pip range and a 100-pip range can give the same reading |
Choosing the Williams %R period
MT5's Williams' Percent Range uses a default period of 14.
| Trading style | Typical timeframe | Period tendency |
|---|---|---|
| Scalping | 5-minute / 15-minute | 7-10: faster, but more crossings, so filter with a level |
| Day trading | 1-hour | 14: a balance of speed and noise |
| Swing trading | 4-hour / daily | 14-21: ignores single-candle spikes |
Markets differ. Before you copy a period from EURUSD to gold, count how often %R crosses -20/-80 on gold's own chart.
Practical tips for trading Williams %R
- Act on crossings at a support or resistance level. A crossing with no level nearby carries less weight.
- Read %R on the chart you trade. A crossing on the 4-hour chart is not a trigger for a 15-minute entry.
- If the 4-hour trend is up, take only the crosses back above -80 on the 1-hour chart and skip the -20 sell signals.
- If the signal candle alone covers most of the 14-candle range, your stop sits far away. Cut the size or skip the trade.
Quick checklist
- Did a candle CLOSE with %R back above -80 (or below -20), not just poke through intrabar?
- Has price stopped making new highs or lows?
- Is high-impact news due within the hour?
- Is your stop behind the extreme swing, not a random number?
FAQ
Should I use -20/-80 or -10/-90 levels on Williams %R?
Tighter levels like -10/-90 only flag the most stretched closes, so you get fewer signals. The standard -20/-80 lines give more signals, including weaker ones. Pick one pair and keep it, so you can compare your trades on the same terms.
What does it mean when Williams %R and price disagree?
If price makes a lower low but %R makes a higher low, closes are no longer finishing as deep in the range. Selling pressure may be fading. Treat it as a warning, not an entry, and still wait for the cross back above -80.
What does a Williams %R reading of -50 tell me?
The close sits in the middle of the recent range. Buyers and sellers are roughly balanced, so the line gives you no timing edge there. Wait for a move into one of the zones and back out.
Who created Williams %R?
Trader Larry Williams designed it, which is where the name comes from. The %R stands for percent range.