









Awesome oscillator
Also called AO, Bill Williams Awesome oscillator, Awesome oscillator histogram
The Awesome oscillator (AO) is a momentum histogram. It subtracts a 34-bar simple average of each candle's midpoint from a 5-bar average of the same midpoints. The result shows whether short-term momentum is running ahead of the longer trend or falling behind it.
AO tells you which side momentum is on. It does not tell you when to buy. Traders who act on every small rise or dip of the bars in a sideways market pay for a string of small losses.
The Awesome oscillator formula and what the bars mean
The calculation uses the median price, which is the midpoint of each candle:
Median price = (High + Low) ÷ 2
AO = 5-bar SMA of median price − 34-bar SMA of median price
AO is drawn as a histogram around a zero line. Above zero, the last 5 bars traded higher on average than the last 34, so short-term momentum points up. Below zero, it points down. The height of a bar shows how far apart the two averages are.
Each bar is coloured by comparing it with the bar before it. It is green if it is higher and red if it is lower. Colour does not tell you direction: a red bar above zero means bullish momentum is fading, not that price is falling.
MT5 default: the Awesome Oscillator uses fixed 5- and 34-period simple averages of the median price and has no inputs.
Reading the three Awesome oscillator signals
Each signal answers a different question:
- Zero-line cross: has momentum changed sides? A move from below zero to above is bullish. The reverse is bearish.
- Saucer: is the trend starting again after a pause? Above zero, two red bars followed by a green bar, with the second red bar shorter than the first, is a buy signal. Below zero, the mirror pattern is a sell signal: two green bars, with the second shorter than the first, followed by a red bar.
- Twin peaks: is the move running out of steam? Below zero, two troughs where the second is shallower, with no zero cross between them, warn that selling pressure is weakening. The signal comes on the first green bar after the second trough. The mirror pattern above zero warns of a top.
The sketch below shows a saucer. Traders often miss this signal because the bars never leave the area above zero.
Twin peaks often shows up as divergence: price makes a lower low while AO makes a higher trough. The chart below shows the pattern with price in the top panel.
A common misread is buying the first green bar after a long run of red bars below zero. Below zero, that bar only tells you selling is slowing down. It is not a long signal unless it completes a twin-peaks pattern or AO crosses above zero.
Trading Awesome oscillator setups with real prices
Zero-line cross on the XAUUSD (gold) 1-hour chart
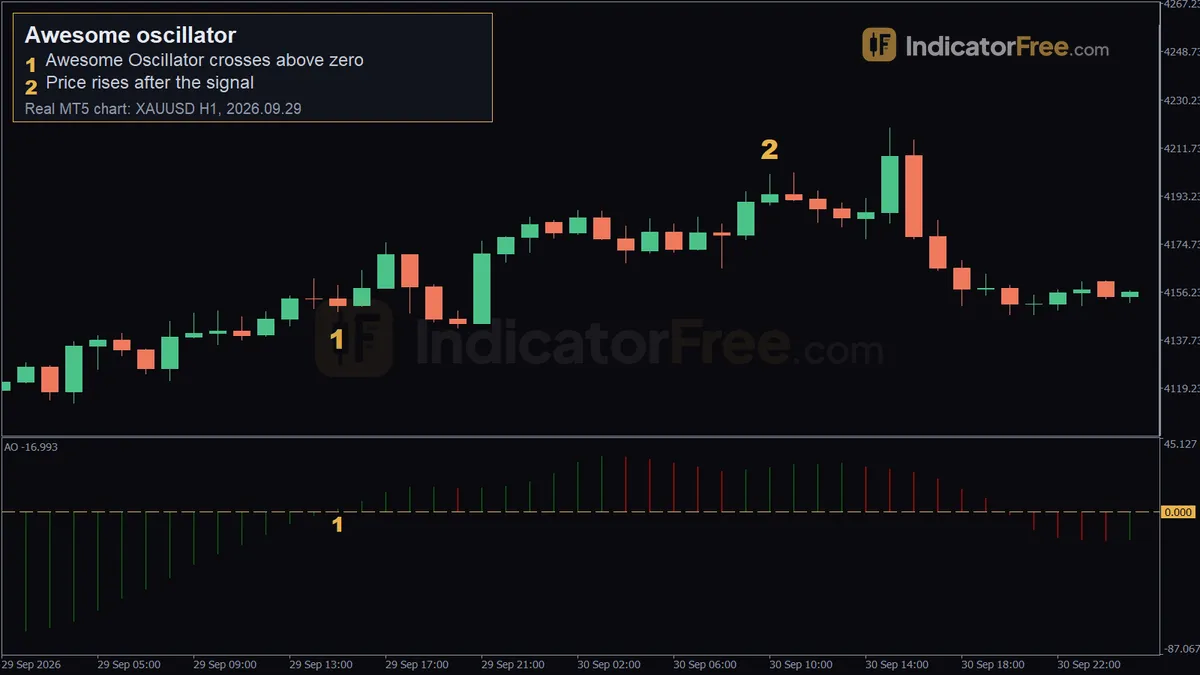
The chart at the top of this page is a past example, not a prediction. On 2026.09.29 at 15:00, the Awesome oscillator crossed above zero on the XAUUSD (gold) 1-hour chart. Marker 1 sits at 4148.69, which is the low of that signal candle. The candle closed at 4151.12. Over the next 20 candles, price rose 51.10, measured from the 4151.12 close to the highest high in those candles. The second marker (2026.09.30 at 10:00, 4201.38) shows the move under way. The move peaked one candle later, at the 4202.22 high of the 11:00 candle, which is 51.10 above the entry.
The AO bars right at marker 1 are very small, so the cross can look flat at zero. Zoom in on the bars directly under marker 1 to see them move from just below zero to just above it. The chart shows other zero crosses too, but only the one at marker 1 is the signal in this example.
- Entry trigger: wait for the bar to close above zero, then enter at that close. In this example the signal candle closed at 4151.12, so that is the entry. The marker price, 4148.69, is the candle's low and not the entry. Waiting for the close protects you from a cross that disappears before the bar ends.
- Stop loss: below the last clear swing low before the cross. If price breaks that low, the momentum shift has failed.
- Exit: close the trade when AO prints two red bars in a row above zero or falls back below zero, whichever comes first. The 51.10 gain used below is the best case, measured to the 4202.22 high. It is not the result of this exit rule, which could have closed the trade earlier and for less.
Here is an illustrative example of the risk. Say your stop sits at the last clear swing low before the cross, the 08:00 candle's 4122.12 low. The 10:00 candle dipped to 4136.04, but that was a small pause inside the climb, not a clear swing, so this example ignores it. That is 29.00 below the 4151.12 entry. You trade 0.10 lot. Gold's contract size on the demo account is 100, so at 0.10 lot each 1.00 move in price is worth $10. Your risk is 29.00 × $10 = $290. If you caught the 51.10 rise over those 20 candles, the gain would be 51.10 × $10 = $511, which is 511 ÷ 290 ≈ 1.76 times your risk.
When the Awesome oscillator helps and when to switch it off
Works well:
- Trending markets with clear swings, where crosses and saucers line up with the trend.
- 1-hour charts and higher for entries on their own. Use lower charts only with a higher-timeframe filter, as the table below shows.
- As a filter, for example taking long setups from your main method only while AO is above zero.
Avoid it or trade smaller:
- Tight ranges, where AO stays close to zero and changes colour every few bars.
- The minutes around major news. A single spike candle can stretch the 5-bar average and create a cross that reverses straight away.
- 1-minute charts, where the candle range is mostly spread and noise.
Pros and cons of the Awesome oscillator
| Pros | Cons |
|---|---|
| No settings to adjust, so you cannot over-fit it | Fixed settings cannot adapt to a slow or fast market |
| Uses the high and low of each candle, not only the close | Built from averages, so it reacts late at turning points |
| Gives three different signals in one panel | Zero crosses whipsaw in ranges |
| Easy to read at a glance on a phone | Bar colour is easy to mistake for price direction |
Which chart timeframe to use the Awesome oscillator on
The 5 and 34 settings are the standard. If you change them, your signals no longer match what other traders see. Choose the chart timeframe that suits your style instead.
| Style | Chart | Best use |
|---|---|---|
| Scalping | 5-minute / 15-minute | Take saucers only in the direction of the 1-hour AO |
| Day trading | 1-hour | Zero crosses and saucers as entries |
| Swing trading | 4-hour / daily | Side of zero as a trend filter, twin peaks as an exit warning |
Gold vs major FX pairs: AO is measured in price units, so a gold bar is far taller than a EURUSD bar. Do not compare bar heights across markets, and do not copy a "big bar" threshold from one market to another. Compare each bar only with recent bars on the same chart.
Practical tips for trading the Awesome oscillator
- Check AO on the next higher timeframe first. Only take signals on your own chart that agree with that timeframe's side of zero.
- Skip zero crosses that come after AO has stayed close to zero for many bars. That is a range, not a new trend.
- Use twin peaks to tighten the stop on an open trade, not to reverse your position.
- Combine AO with a price level. A saucer at support means more than one in the middle of a range.
Quick checklist
- Which side of zero is AO on, on this chart and on the higher timeframe?
- Is the signal a cross, a saucer or twin peaks, and has the bar closed?
- Is a high-impact news release due in the next hour?
- Where is the swing low or high that would prove the trade wrong?
FAQ
What is the difference between the Awesome oscillator and MACD?
AO subtracts two simple averages of each candle's midpoint, uses fixed periods and has no signal line. MACD is built from exponential averages of the closing price, lets you change its periods and adds a signal line. Because AO uses the high and low, it reacts to a candle's whole range, while MACD reacts only to where candles close.
Does the Awesome oscillator work on stocks and indices?
Yes. It needs only each candle's high and low, so it works on any market with candles. The rules are the same: read which side of zero it is on, the colour changes and the pattern shape.