









Consolidation
Also called Trading range, Sideways market, Range-bound market, Price consolidation, Consolidation zone
Consolidation is a period when price moves sideways between a clear ceiling and floor instead of trending, as buyers and sellers balance out before the next directional move.
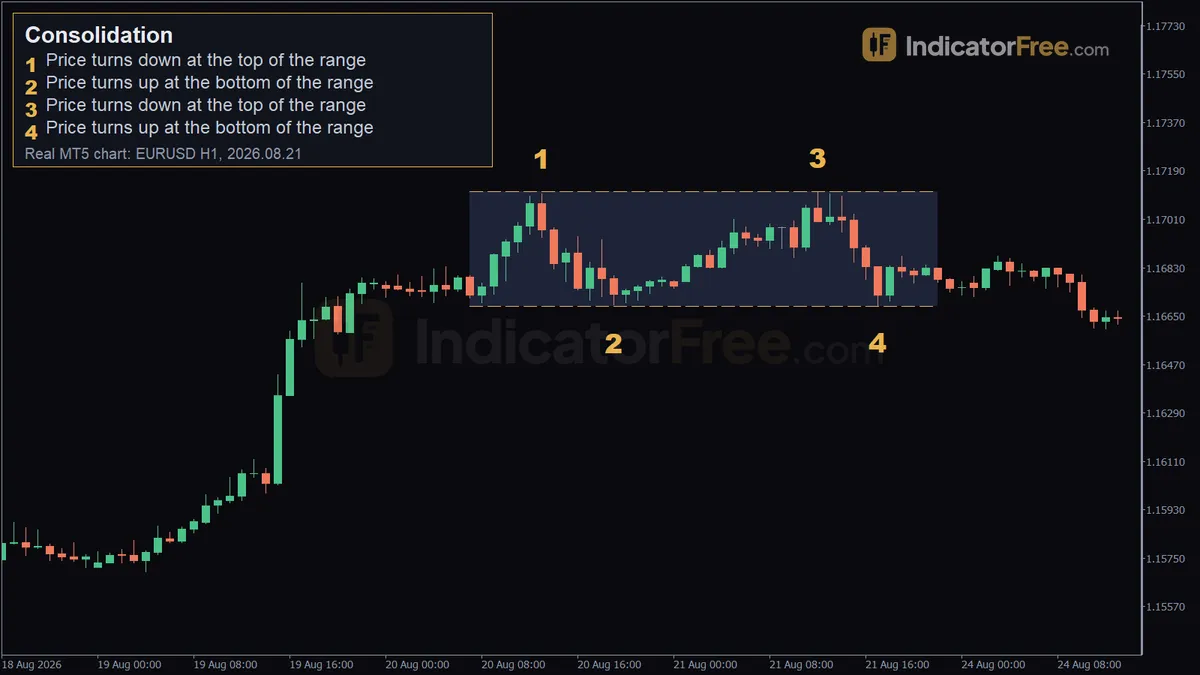
Price spends a large share of its time moving sideways. If you trade a sideways stretch as if it were a trend, you tend to buy near the ceiling and sell near the floor, and you lose on both. Spotting consolidation early helps you pick your plan: trade the edges while the box holds, or wait for price to break out.
How to spot consolidation: a 6-point checklist
Check these in order. If any point fails, you are looking at something else, such as a slow trend or a channel.
- Mark at least two highs that stop at about the same price. That ceiling is resistance, the level where selling has turned price down.
- Mark at least two lows that stop at about the same price. That floor is support, the level where buying has turned price up.
- Count the turns. You need at least four in total, switching between the top and the bottom.
- Compare the height of the box with the move that came before it. A consolidation is clearly narrower than the swing that led into it.
- Look at the candles inside. They are mixed in colour and similar in size, not a run of large candles in one direction.
- Check the closes. Wicks may poke past an edge, but the candles close back inside.
The chart below shows the textbook shape: a rise, then a flat box where price turns repeatedly at both edges, then a candle that closes above the top.
Reading the EURUSD 1-hour example, turn by turn
The chart at the top of the page is a past example, not a prediction. EURUSD on the 1-hour chart stayed between 1.16687 and 1.17113 from 2026.08.20 07:00 to 2026.08.21 22:00, a 43-pip box. Price turned at the edges at least four times.
- Marker 1 (2026.08.20 13:00, 1.17105): price turns down at the top. This is the first ceiling touch.
- Marker 2 (2026.08.20 19:00, 1.16692): price turns up at the bottom. Now you have both edges.
- Marker 3 (2026.08.21 12:00, 1.17113): price turns down at the top again, less than 1 pip above marker 1. The ceiling is confirmed.
- Marker 4 (2026.08.21 17:00, 1.16687): price turns up at the bottom again, half a pip below marker 2. With four turns, the checklist is complete.
Notice that the second touches went slightly past the first ones on both sides. Edges are thin zones, not exact lines. Here the top zone runs from 1.17105 to 1.17113 and the bottom zone from 1.16687 to 1.16692.
Strong, weak and broken consolidation
A strong consolidation has flat edges, four or more clean turns, and closes that stay inside. It is also tall enough to hold your stop and the spread with room to spare.
It is weak when you only have two touches, or when the box is so narrow that trading costs eat most of it. If the edges slope, it is not a consolidation at all but a channel or a flag. A range made by a single large news candle is also weak. It reflects one event, not balance between buyers and sellers.
It is broken when a candle closes beyond an edge and the next candle stays out there. A wick through the edge followed by a close back inside is only a probe. When that probe traps traders, it is a false breakout.
A common misread is a slow climb with overlapping candles. It looks sideways, but each low sits a little higher than the last. To test it, draw a horizontal line at the first high. If later highs keep clearing that line by more than a few pips, you are in a trend, not a consolidation.
Two ways to trade a consolidation range
The two plans below are an illustrative example built on the edges of the EURUSD box above. They show where to place each order. They are not a record of real trades, and they do not show what price did next.
Fading the edges: buy near support, sell near resistance
Fading means trading against the move into an edge and expecting price to turn back. You buy just above the 1.16687–1.16692 floor zone, once a candle turns up from it. Your stop loss goes a few pips below the lowest low of 1.16687. Your target sits just under the 1.17105–1.17113 ceiling zone. Say your entry ends up 3 pips above the floor and your stop 5 pips below it: you risk 8 pips. Taking profit 4 pips short of the top leaves 43 − 3 − 4 = 36 pips to make.
The sell version mirrors it. Sell just under the ceiling zone after a candle turns down, put the stop a few pips above the 1.17113 high, and target just above the floor zone. The sizing below is an illustrative example for a $10,000 account held in US dollars, risking 1% per trade. For that account, one pip on 1.00 lot of EURUSD is worth $10. In another account currency the pip value is different.
Trading the break: wait for a close outside the box
Here you do nothing until a 1-hour candle closes above 1.17113. You then buy, and put the stop back inside the box. If your entry is 4 pips above the top and your stop 6 pips inside it, you risk 10 pips. For the target, project the 43-pip height of the box above the 1.17113 top.
The exit rule matters more than the target. If a candle closes back inside the box, close the trade. A failed break often runs to the opposite edge. The same plan works downward from a close below 1.16687.
When range trading pays and when to stay out
Consolidation trading works best in quiet hours between scheduled news, in ranges with four or more clean turns, and when the box is several times taller than your stop plus the spread.
Stay out of edge trades just before high-impact news, when the box has shrunk so much that costs eat the move, and around busy session opens such as the London or New York open, when quiet ranges are often tested.
Whichever plan you choose, write its exit rule down before you enter.
| Approach | Pros | Cons |
|---|---|---|
| Fading the edges | Tight stop, clear levels, several chances per range | One real breakout stops you out |
| Trading the break | Catches the move out of the range, uses a measured target | Many breaks fail and slip back inside |
| Waiting it out | No cost, keeps your capital free | You miss the move if the range resolves quickly |
Bullish and bearish consolidation
A bullish consolidation is a flat pause after a rise, where traders watch for a break upward. A bull flag or an ascending triangle can form in the same spot, but each has a sloping edge, so it is a separate pattern with its own entries, not a consolidation box.
A bearish consolidation is a flat pause after a fall, where traders watch for a break downward. The bear flag and the descending triangle are the sloping-edge patterns that form in the same spot, and they follow their own rules.
Practical tips for trading inside and out of a range
- Check the next timeframe up. A 1-hour box can be a pullback inside a 4-hour trend, and the break usually counts for more in the trend's direction.
- Pick one plan per range, fade or breakout. Holding both at once usually means taking two stop-outs.
FAQ
How long does a consolidation usually last?
There is no fixed length. It can last a handful of 1-minute candles for a day trader or several weeks on a daily chart. Judge it by the number of clean turns, not by the clock. The same rules apply to forex, stocks and crypto.
Does consolidation mean the trend will continue or reverse?
Neither on its own. The box only shows balance. The direction of the first close outside it, and whether the next candle holds out there, tells you which side won.
Why does price so often poke just past the edge before turning?
Many traders place stops just beyond obvious highs and lows. Price often reaches those orders briefly before turning back, so set your stop a few pips beyond the edge zone, not right on it.