









Session low
Also called Low of the session, Session lows, Asian session low, London session low, New York session low, Previous session low
A session low is the lowest price traded during one trading session, such as the Asian, London or New York session. Traders mark it as support: a candle closing below it signals a downside breakout, while a quick dip and recovery signals a failed one.
A session low only helps if you mark it before price gets there. Fixed in advance, it tells you where a short becomes valid, where a long is wrong, and how far away your stop must sit. That distance is the money you put at risk.
How to mark a session low in 5 steps
- Pick one session and set its start and end on your chart's clock. Your broker's server time may differ from your local time.
- Wait for the session to finish. Until then you only have a running low, which moves each time price trades lower.
- Find the lowest wick inside the session window. Use the wick, not the lowest close.
- Draw a horizontal line at that price and extend it into the next session.
- Mark the session high as well. The distance between the two is the session range, and you need it for stops and targets.
What makes a session low valid, weak or broken
A valid session low belongs to a finished session and stands out on the chart. Price touched the area more than once, or turned away from it sharply. The session range is a normal size for that instrument.
A weak one was set by a single spike in thin trading or during a news release. It is also weak when the range is so narrow that ordinary noise can cross it, or when the next session has already tested it several times.
A session low is broken only when a candle closes below it. After that, the level often acts as resistance when price comes back up.
The common misread is treating a wick as a break. A wick that dips below the low and closes back above it is a sweep: price triggers the stop orders resting under the low, then returns. On a phone it is easy to judge the candle while it is still forming. If the candle has not closed, you have no signal yet.
The EUR/USD session low on 23 June 2026, marker by marker
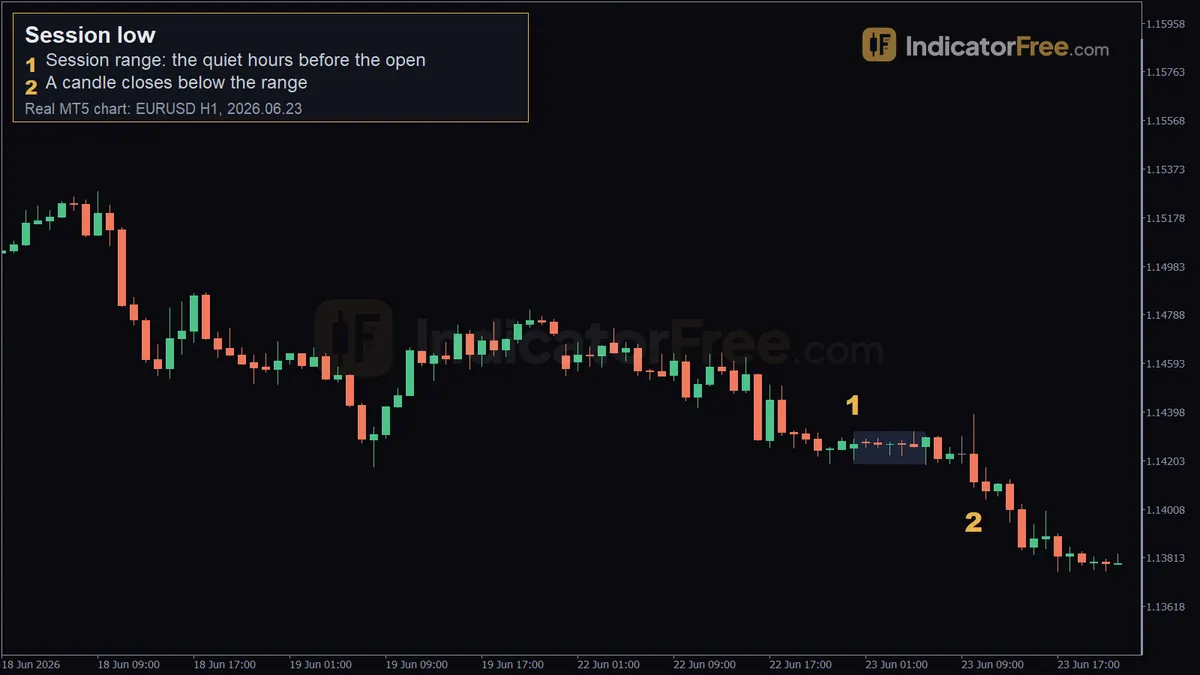
The chart at the top of the page is a past EUR/USD 1-hour example, not a prediction.
Marker 1, the session range. Between 00:00 and 06:00 on 2026.06.23, price stayed between 1.14187 and 1.14319. That is a 13-pip range, and 1.14187 is the session low. The marker sits at 1.1429, inside these quiet hours before the open.
Marker 2, a candle closes below the range. The 10:00 candle closed at 1.14118, which is 6.9 pips under the session low. The marker is placed at 1.14097 on that candle. Because the close is below the line, this is a break, not a sweep.
For scale, the Lab measured EUR/USD 1-hour candles from 2025-10-02 to 2026-10-02 (6222 candles, broker demo data). The average single candle in Asian hours covered 8.8 pips. The whole six-hour range here was about one and a half of those candles, so it was a tight range (past data, not a forecast).
Two ways to trade a session low
Setup 1: Close below the low, then sell the retest (prices from the 23 June chart)
The range height is 1.14319 − 1.14187 = 13.2 pips. A common target projects that height below the low, so it sits 13.2 pips under 1.14187. A common stop sits at the middle of the range, 6.6 pips above 1.14187, because a return there means the break has failed.
Selling the close at 1.14118 gives a poor trade. The stop is 13.5 pips away and the target only 6.3 pips away.
Selling a retest of the broken low changes the numbers:
- Entry: 1.14187, if price returns to the old low and rejects it.
- Stop loss: the middle of the range, which is 6.6 pips of risk.
- Target: one range height below the entry, which is 13.2 pips of reward.
The decision rule: if the breakout candle closes more than half the range height beyond the low, do not chase it. Wait for the retest. Here half the range is 6.6 pips and the close was 6.9 pips below, so the rule says wait. The chart does not show whether a retest came. This is how the plan is built, not a result.
Setup 2: Sweep below the low, then buy the reclaim
The figures in this setup are an illustrative example with round numbers. A session sets a low and a high 22 pips apart. In the next session one candle dips 5 pips under the low and closes back inside the range, 3 pips above the low, as the chart below shows.
- Entry: buy at the close of the sweep candle, once it has closed back above the low.
- Stop loss: two pips under the sweep wick. Risk is 10 pips.
- Target: the session high. Reward is 19 pips.
Size the trade from the stop, not from a feeling. With a 5,000 dollar account, 1% risk and a pair quoted in US dollars, where one standard lot (100,000 units) moves 10 dollars per pip, the sum looks like this:
When a session low is worth trading, and when to leave it alone
A low matters most when the next session is more active than the one that set it. The Lab's EUR/USD 1-hour figures show the size of that gap.
A low set during 8.8-pip candles is then met by 13.1-pip and 17.8-pip candles. That is why the Asian low is tested so often in the London morning. These are past data, not a forecast.
Do not copy that assumption to every market. In the same period, gold (XAUUSD, 1-hour, 5917 candles) averaged 21.3 dollars per candle in Asian hours and 18.9 dollars in the London morning. On gold the Asian low was not set in quieter hours in that sample.
Avoid the level in the minutes around a major news release, when the range is far smaller than usual, and late in the day when the active session is ending.
| Pros | Cons |
|---|---|
| One objective price, fixed in advance | Sweeps and real breaks look the same until the candle closes |
| Gives a clear place where the trade is wrong | Waiting for the close can leave a poor entry price |
| Works for both breakout and reversal plans | The level depends on which session hours you use |
| The session range gives a ready stop and target distance | A tight range gets crossed by ordinary noise |
Bullish and bearish readings of the same level
Bearish: a candle closes below the session low and the level turns into resistance. This is the downside case of a Range breakout, often followed by a Breakout retest.
Bullish: price sweeps the low, closes back above it and heads for the Session high. The failed push lower is a False breakout.
Practical tips for trading session lows
- Keep the previous session's low on the chart after a new session starts. It stays a reference until price has clearly dealt with it.
- Compare the session range with recent ranges before trading. A range much tighter than usual needs a wider buffer, or no trade.
- Place stops a few pips beyond the level or the wick, never exactly on it. The line is where other traders' stops gather.
- Decide before the open whether you are trading the break or the sweep. Switching mid-candle is how you get caught in both.
- Add the spread to a stop on a short trade. Shorts close at the ask price, which is higher than the price your chart draws.
Quick checklist before you act on a session low
- Session finished and the low drawn at the wick?
- Has the candle closed, and on which side of the line?
- Is the entry less than half the range height past the level?
- Stop, target and lot size written down before the order?
FAQ
Will a session high and low indicator on TradingView show the same levels as my broker's chart?
Not always. The level depends on the session hours set in the indicator and on the price feed behind the chart. Check that the hours match the session you mean, and expect small differences between feeds.
Does the session low reset every day?
Yes. Each new session starts with no low and builds one as it trades. The earlier low becomes the previous session's low, which many traders keep as a separate line.
Which timeframe should I use to mark a session low?
The level is the same price on every timeframe, because it is simply the lowest trade in the window. A 15-minute or 1-hour chart makes the window easy to see. What changes with timeframe is how long you wait for a candle close to confirm a break.